Announcements
Media
League of Traders Weekly Report (2nd week of October 2023)
League of Traders EN
|
Oct 25, 2023 07:53 (UTC+0)
The Weekly Report is our summary of key indicators and recent events in the crypto world that professional traders are closely monitoring. This report and other relevant information are first shared via the official League of Traders Telegram channel.
Here are our notes for the second week of October!
- Bitcoin Chart/Ethereum Chart
Last week, the price of Bitcoin at one point reached over $28 000 but has since retreated down to $27 600. This is an important indication to determine if the price could potentially continue its upward rally beyond $26,000 at the end of September. If US interest rates or the US dollar index were to jump up, assets such as Bitcoin would be more likely to rise, though the situation in the Middle East has been deteriorating since the conflict between Israel and Palestine began intensifying over the weekend. The deteriorating situation in the Middle East is raising the possibility of a worst-case scenario leading to higher oil prices → worsening inflation → further interest rate hikes → asset market crashes, so caution is advised.
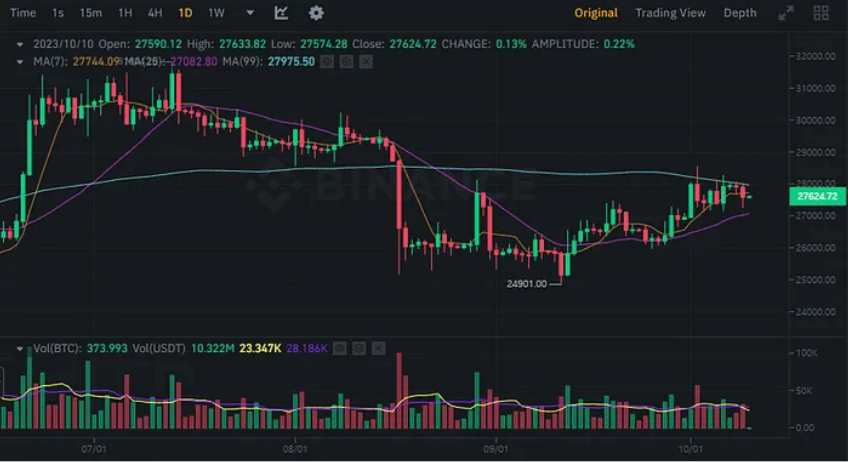 BTCUSDT Chart (Binance)
Ethereum’s price has been more volatile than Bitcoin’s, sitting at the 1580 level. While Bitcoin’s 25-day moving average is trending upward, Ethereum’s 25-day moving average is on the verge of turning downward. Unless there’s a major breakout for Ethereum, it’s likely to remain unstable relative to Bitcoin for the foreseeable future.
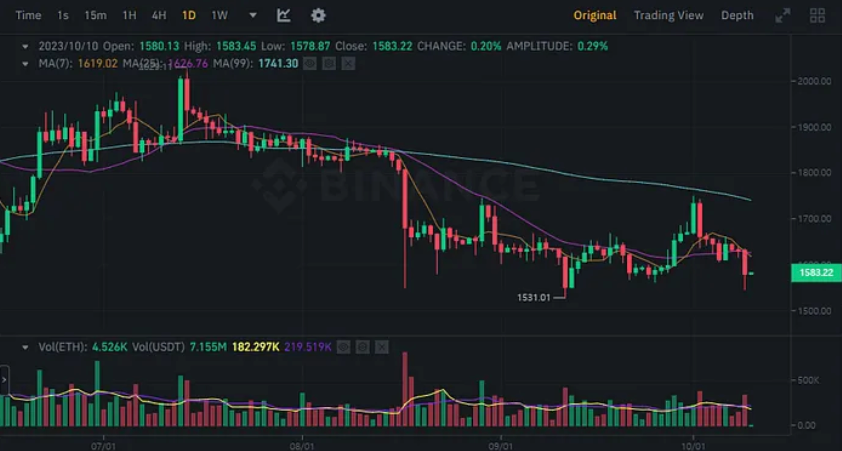 ETHUSDT Chart (Binance)
Bitcoin’s dominance over MarketCap has broken through the 50% mark and sits at 51.26%. With the ongoing weakness of Ethereum and the recent increase in production by Bitcoin mining companies, which led to expectations of halving, Bitcoin dominance may be maintained or continue to rise for the foreseeable future.
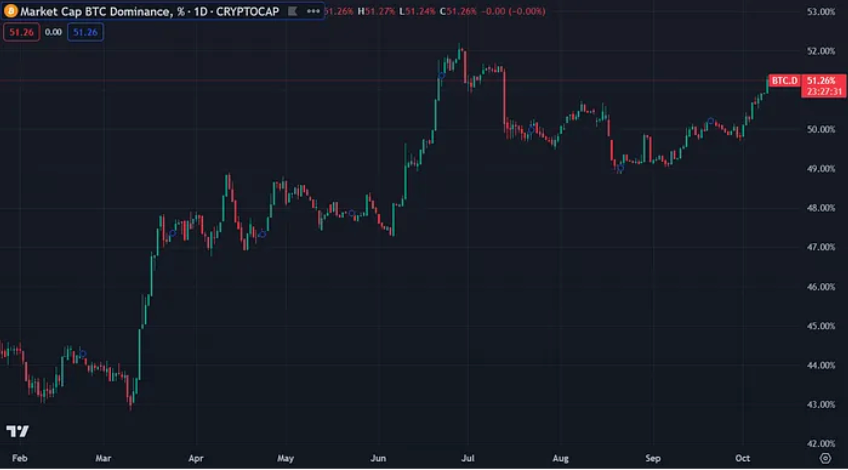 Bitcoin dominance chart (CoinMarketCap)
2. Major Economic Indicators
- US Bond Yields
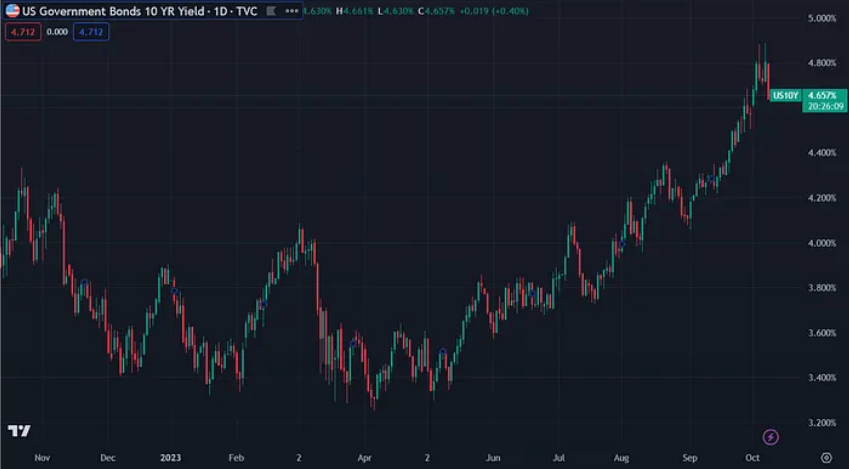
The U.S. 10-year Treasury rate rose above 4.8%, as some experts expected, and then corrected itself down to 4.657%. The 10-year rate has been at its highest level in 16 years since August 2007.
However, the outbreak of the Israeli-Palestinian war has increased interest in safe-haven assets. Only the futures market was open on the 9th, when fears of conflict in the Middle East boosted demand for U.S. Treasuries, sending prices soaring and rates falling. Bloomberg predicted that when the spot market for U.S. Treasuries, which was closed on the 9th for a U.S. national holiday, reopened on the 10th, Treasury rates would fall significantly. However, there is also a view that in the medium to long term, the deteriorating situation in the Middle East could stimulate inflation in the U.S. and push interest rates higher.
 US10YPrice Government Bond Rate (TradingView)
- US Dollar Index
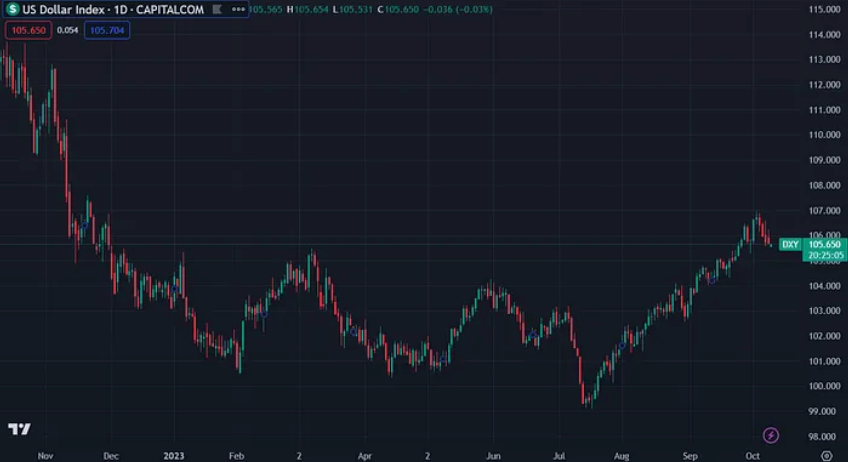
The U.S. Dollar Index hit a high of nearly 107 and is currently trading at 105.650. As the war between Israel and Palestine looks set to escalate from a localized conflict to an all-out war, safe-haven appetite is likely to rise, leading to further gains in the dollar index.
 US Dollar Index (TradingView)
- US100 (Nasdaq 100)
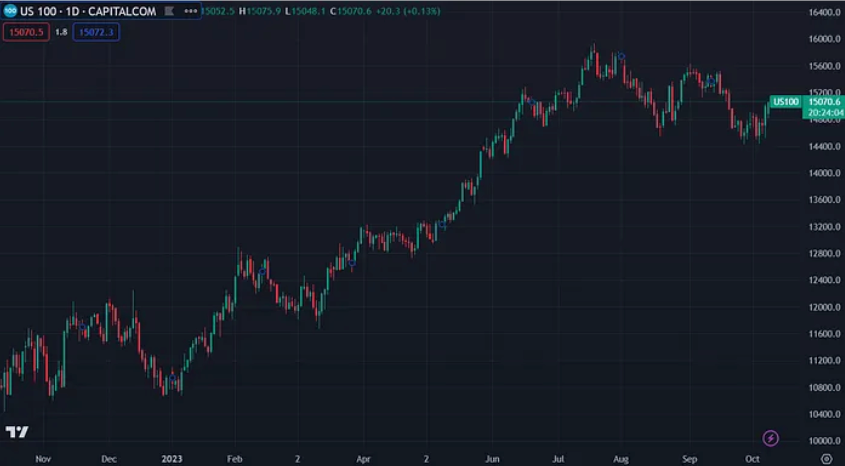
The Nasdaq 100 is up slightly and sits at the 15000 level despite a rise in the U.S. 10-year Treasury rate and the Middle East’s rising conflict. Energy technology stocks, including Diamondback Energy and Baker Hughes, surged to lead the Nasdaq 100 as international oil prices soared more than 4% in the aftermath of the Israel-Palestine armed conflict, while travel-related electric vehicle, and semiconductor stocks, fell. Wall Street analysts worried that geopolitical tensions could dampen investor sentiment and add uncertainty to the outlook, but they said it would take a few days to gauge the full impact, and markets are taking a wait-and-see approach to the situation.
 US100 (TradingView)
- Gold Futures
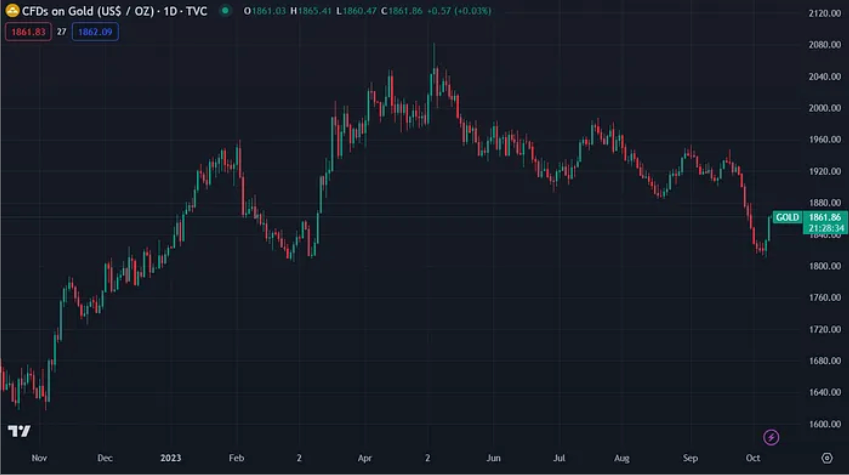
The price of gold futures fell to the low $1800s last week before rising to the $1860 level, which could be attributed to the relative weakness of the gold price due to the continued rise in US Treasury yields and the strength of the dollar. However, we believe that gold prices could rebound in the near term as safe-haven demands rise from conflicts in the Middle East.
 Gold Futures (TradingView)
3. Bitcoin Market Data
- MVRV Z-score
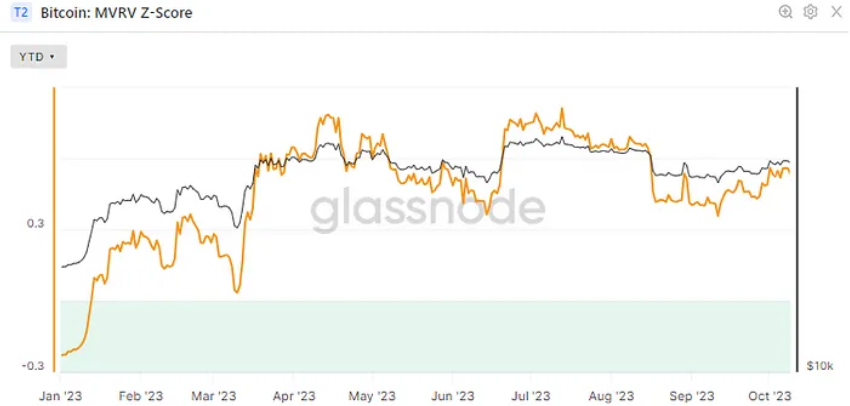
The MVRV Z-score is hovering around 0.53, up from 0.44. It will be interesting to see if the MVRV Z score can continue to show signs that it will break out of the undervalued zone.
- Indicator explanation: The MVRV Z-score is a measure that determines whether Bitcoin’s market cap is overvalued or undervalued by dividing the difference between Bitcoin’s market cap and realized cap by the standard deviation. If the MVRV Z-score is below 0, Bitcoin can be considered to be undervalued. In the overheated market that reached the All-Time High (ATH) in 2021, scores of 6 or higher were shown.
 Bitcoin: MVRV Z Score (Glassnode)
- aSOPR
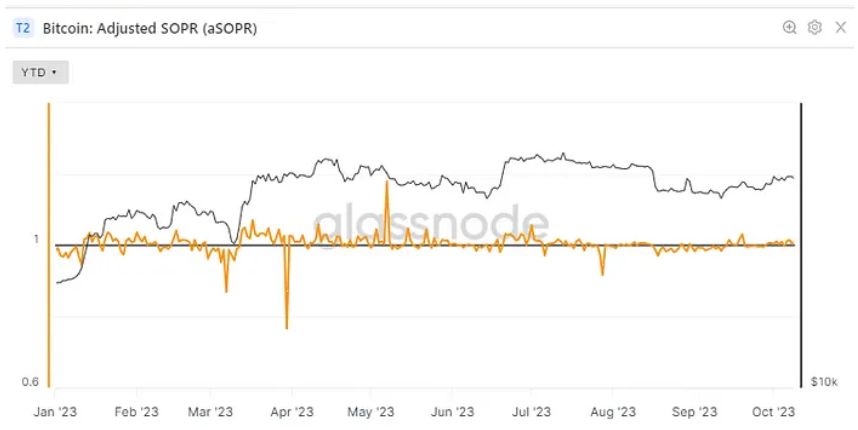
The aSOPR is above 1 at 1.012. This could be interpreted as a result of the modest increase in Bitcoin’s price since the end of September. In a bull market, the aSOPR tends to stay consistently above 1, so we’ll need to see if that number can hold or rise further.
*aSOPR is short for Adjusted Spent Outfit Profit Ratio, a value obtained by dividing the price of received bitcoin in the past by the price at the time of transmission. When SOPR is less than 1, it indicates a downtrend, and when it is above 1, it indicates an uptrend. aSOPR is a more accurate value that removes meaningless transactions within the hour for adjustments.
 Adjusted SOPR (Glassnode)
- Open Interest
Open interest in Bitcoin perpetual futures rose from $7.2B to $8B and is now at $7.9B. While open interest has been rising steadily since October, it’s still lower than the $9B at the end of August, which was a big drop.
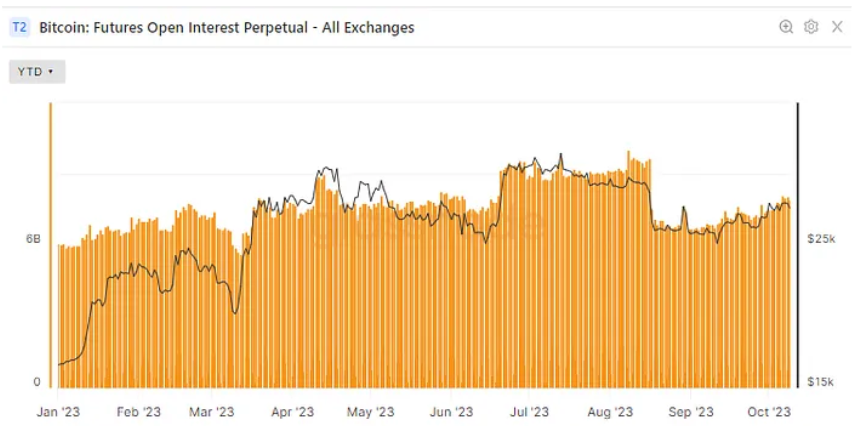 Outstanding Open Interests by Exchanges (Glassnode)
The exchanges’ combined estimated futures leverage ratio rose to 0.22, though this is not a very high leverage, compared to 0.30 at the end of January when the market was rising to 0.25 at the end of August when it was falling.
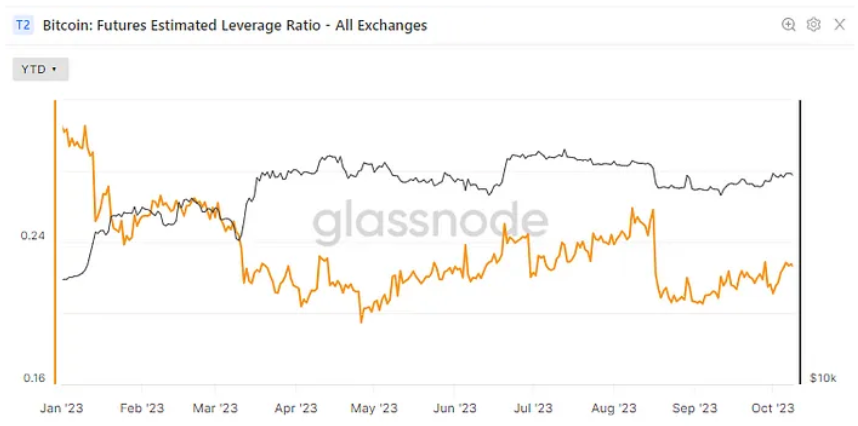 Exchanges’ combined estimated leverage ratio (Glassnode)
4. On-chain data
- Exchange inflows and outflows
Exchange Bitcoin holdings are showing an outflow dominance again after five months of inflows at the end of September. Since the increase in inflows is very small compared to outflows, it can be assumed that exchanges are still exiting Bitcoin, possibly due to accumulation by institutional investors looking to take advantage of the rising price of Bitcoin as it approaches its halving.
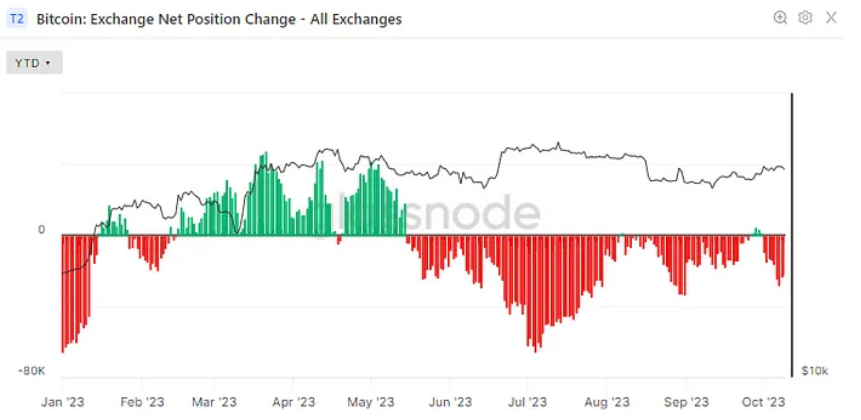 Bitcoin: Exchange Net Position Change (Glassnode)
- Number of Whale Wallets
The number of 10k+ whale wallets dipped last week and then rose again. It is promising to see that the number of whale wallets hasn’t dropped despite the rise in Bitcoin’s price. We can interpret this as a sign that the current price range is one where it makes sense to buy or hold Bitcoin, even for large whales.
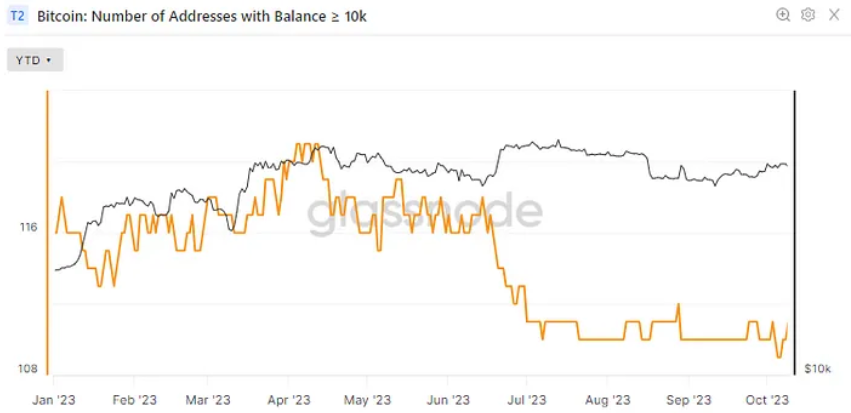 Number of Bitcoin wallets holding 10K or more (Glassnode)
5. Last week’s major news:
- Bloomberg analyst sees BTC weakening on Israel-Palestine war, risk-off speculation
Mike McGlone, senior macro strategist at Bloomberg Intelligence, wrote on X (formerly Twitter) that “Bitcoin showing risk off tilt in the aftermath of Hamas-Israel escalation. My bias is the downward-sloping 100-week moving average is likely to win the battle vs. the up-trending 50-week. Spiking crude oil is a liquidity pressure factor.”
- SEC delays approval of Ark Bitcoin ETF to next year
The U.S. Securities and Exchange Commission (SEC) has delayed its final approval decision on the ARC 21 Shares Bitcoin ETF to January 10th of next year, The Block. The delay comes just hours after Republican and Democratic lawmakers pressed SEC Chairman Gary Gensler to list a bitcoin spot ETF. The SEC cited the need for sufficient time to review the proposed rule change as the reason for the delay.
- Frantec earns $27 billion two months after launching
The team behind social protocol Friend.tech has reportedly earned nearly $20 million in revenue in just over two months since launching in August. According to the latest data from DeFiRama, Friend.tech has become the largest revenue-generating decentralized application (Dapp) in BASE, and the second largest revenue-generating Dapp of all cryptocurrencies, The Block reported.
6. Major economic events
- Major economic events last week
The economic data that garnered the most attention last week was the US Non-Farm Payrolls data from September. With a reading of 336k, almost double what was forecasted, market participants increased the odds of the Fed raising interest rates further this year from 48% to 56%. The 10-year U.S. Treasury rate hit a new 2007 high at 4.89% at one point during local trading on Friday, while the 30-year rose to 5.05%.
Overshadowing this economic data, however, were the outbreaks of the Israel-Palestine attacks. Traders are bracing for market shocks from the outbreak of war while keeping an eye on the possibility of it spreading to other parts of the Middle East.
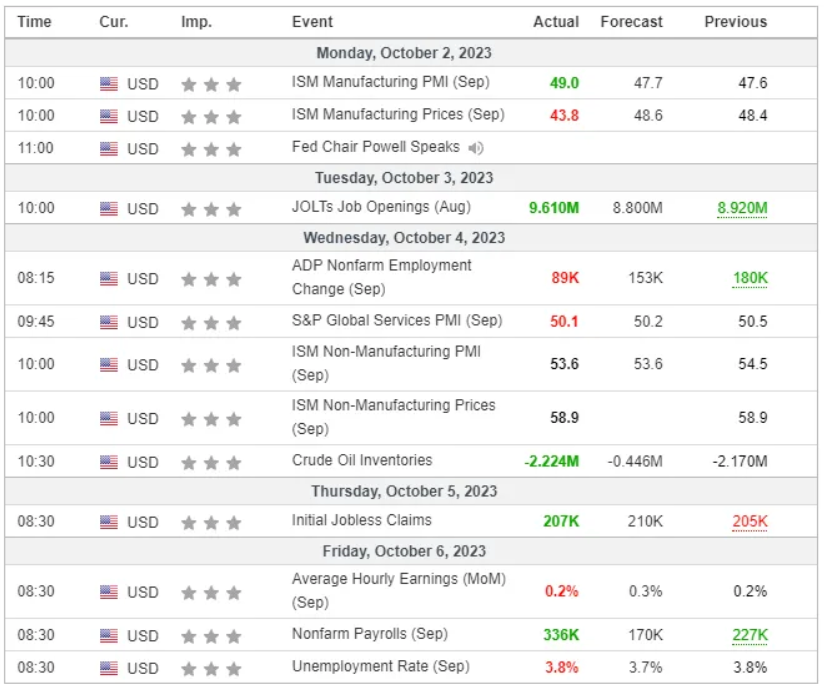 Major Economic Events for the 1st week of October 2023 (Investing.com)
- This week’s major economic events
The FOMC meeting minutes and Thursday’s consumer price index are both key updates to look out for this week. Given the unrest in the Middle East, the change in US crude oil inventories is also an important indicator to watch. Additionally, we will continue to keep an eye out for any new developments in the Israeli war with Iran.
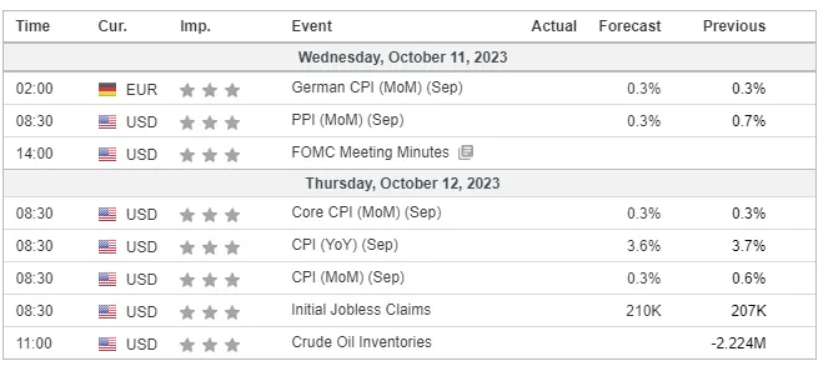 Major Economic Events for the 2nd week of October 2023 (Investing.com)
Summary
Positive indicators: MVRV Z-score, aSOPR, exchange outflows and inflows, whale wallet count
Negative indicators: US bond rates, US dollar index, open interest
Overall Review: The Israel-Palestine attacks have unsettled the international community and increased safe-haven sentiments in the market. However, price-related indicators such as Bitcoin’s MVRV Z-score and aSOPR, as well as on-chain indicators like exchange outflows and whale wallet counts, are showing signs of a bull market. Therefore, due to external factors, taking advantage of Bitcoin’s downturn is a good trading strategy to apply.