Announcements
Media
League of Traders Weekly Report (4th week of December 2023)
League of Traders EN
|
Dec 27, 2023 08:11 (UTC+0)
The Weekly Report is our summary of key indicators and recent events in the crypto world that professional traders are closely monitoring. This report and other relevant information are first shared via the official League of Traders Telegram channel.
Here are our notes for the last week of the year!
- Bitcoin Chart/Ethereum Chart
Bitcoin’s price rose from $41,300 last week but failed to break the $45,000 resistance level, remaining stuck at the $42,800 mark. Recent reports on Reddit suggesting that Mt. Gox’s bonds have been redeemed for cash have dampened Bitcoin’s gains. Earlier, Nobuaki Kobayashi, Mt. Gox’s rehabilitation trustee and bankruptcy administrator, stated in an email to creditors on November 21 that the company “plans to initiate cash repayments to creditors in 2023, with the repayment process continuing into 2024.” According to this plan, Mt. Gox will either sell Bitcoin to cover the cash redemption in 2023 or distribute approximately 137,000 bitcoins to creditors in 2024. At the time of Mt. Gox’s hacking, the price of Bitcoin was around $570. Concerns have arisen that if creditors are given Bitcoin, it may exert selling pressure on the market. However, since Mt. Gox has until October of next year to repay its creditors, and the address of Mt. Gox’s Bitcoin wallet is already known, there is relatively little risk of a short-term sell-off due to Mt. Gox’s repayment schedule.
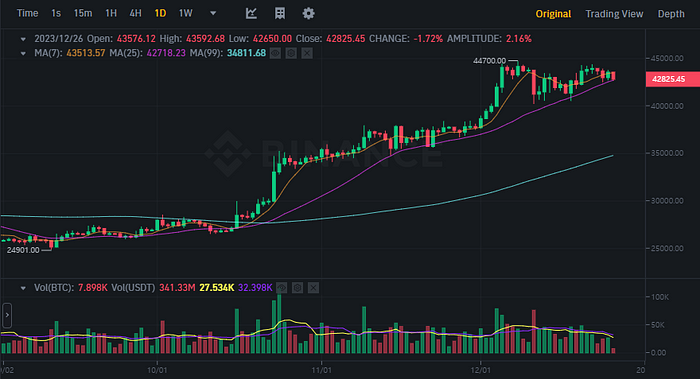 BTCUSDT Chart (Binance)
Ethereum’s price rebounded from below $2,200 to $2,300 before marking at $2,238. Considering the current range, a potential breach below the short-term support of $2,100 may sustain the downtrend. However, there is speculation about DenCun upgrade, an upcoming update aimed at enhancing the Ethereum network, scheduled for January next year. Additionally, there are expectations that an Ethereum spot ETF could gain approval around May next year, potentially causing an uptick in the market upon such news.
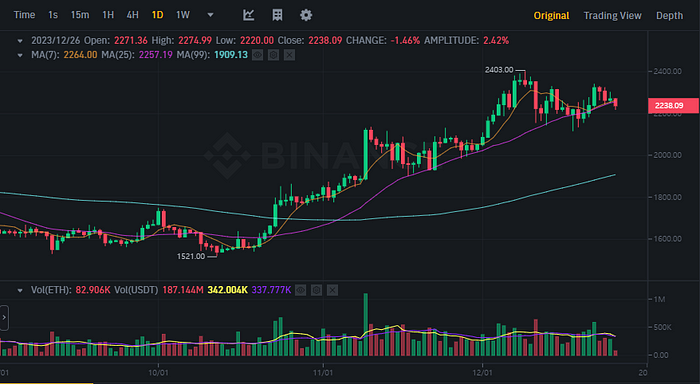 ETHUSDT Chart (Binance)
Bitcoin’s dominance decreased from 53.09% to 52.05%. The surge in altcoins was led by Layer1 blockchains such as Solana, Sei, and Sui, along with Stacks. Notably, the Solana network witnessed a significant surge in network activity, with trading volume on Solana-based decentralized exchanges (DEXs) surpassing that of Ethereum-based DEXs. In terms of price, Solana’s market capitalization has also surpassed Ripple (XRP), making it the fourth-largest cryptocurrency by market capitalization among all cryptocurrencies.
As the early January Bitcoin spot ETF approval date approaches, we anticipate mixed trends in Bitcoin Dominance, with a blend of profit-taking and wait-and-see moves coupled with news-driven buying.
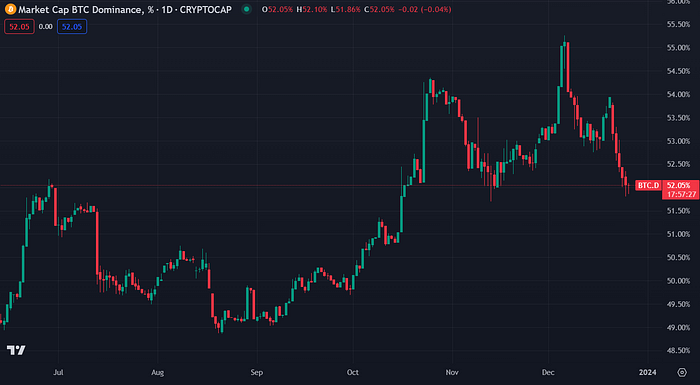 Bitcoin dominance chart (CoinMarketCap)
- Major Economic Indicators
- US Bond Yields
The US 10-year Treasury rate continued its downward trend, decreasing from 3.928% to 3.882%. The U.S. Federal Reserve’s (Fed) preferred inflation measure slowed more than anticipated. Andrew Hunter from Capital Economics noted in a report, “This is clear evidence that the post-pandemic surge in inflation is now over,” suggesting the possibility of the Fed initiating rate cuts as early as March of next year. Market rates also mirrored this expectation, experiencing a decline.
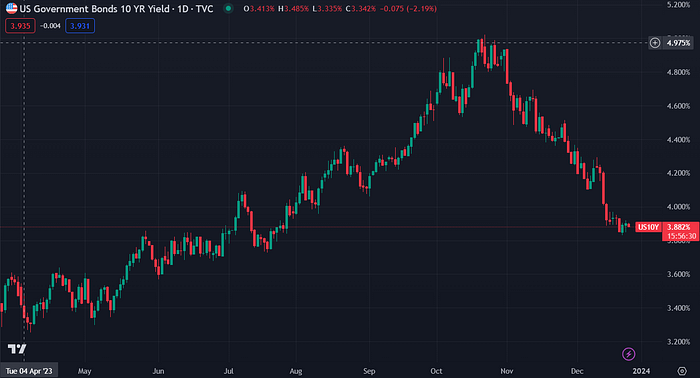 US10YPrice Government Bond Rate (TradingView)
- US Dollar Index
The U.S. dollar index also declined from 102.544 to 101.607, accompanied by a drop in U.S. Treasury yields. Speaking at an event hosted by the Federation of Japanese Business Organizations in Tokyo, Bank of Japan Governor Ueda stated, “The likelihood of achieving the inflation target (2.0%) is gradually increasing,” and added, “The virtuous cycle of wages and prices is strengthening, making it more likely that the inflation stability target of 2.0% will be achieved. If the virtuous cycle of wages and prices strengthens, and the likelihood of achieving the 2.0% annual inflation target on a sustained and stable basis increases, we will consider changing monetary policy,” fulfilling market expectations that Japan will normalize interest rates, abandoning negative rates and yield curve control (YCC). With Treasury yields falling and the Bank of Japan hinting at rate normalization as expected, the U.S. Dollar Index is likely to continue weakening.
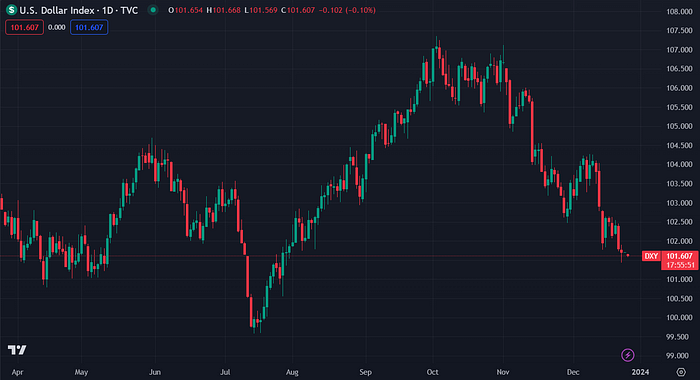 US Dollar Index (TradingView)
- US100 (Nasdaq 100)
The US100 surged further from 16,600 to 16,800. US equities have sustained their rally amid expectations of additional monetary easing from major central banks. As the year-end rally persists, it seems probable that we will conclude the year with relatively limited volatility and mixed results, given ongoing profit-taking sell-offs.
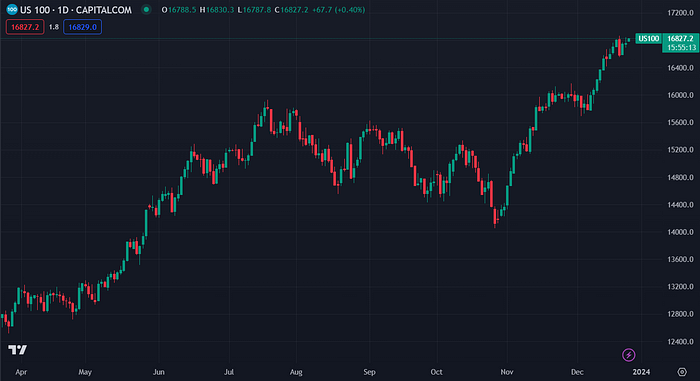 US100 (TradingView)
- Gold Futures
Gold futures climbed from 2021 to 2061 last week. After hitting an all-time high on December 1 and subsequently undergoing a correction, the price of gold has once again risen, setting its sights on a new all-time high. There’s a perspective that the growing anticipation of interest rate cuts has heightened the demand for gold as a short-term hedge — a move to replace currency with an asset that preserves value during a period of currency depreciation. This rationale aligns with the logic that also applies to Bitcoin, potentially influencing the prices of alternative value-storing assets like gold and Bitcoin, especially in relation to the dollar.
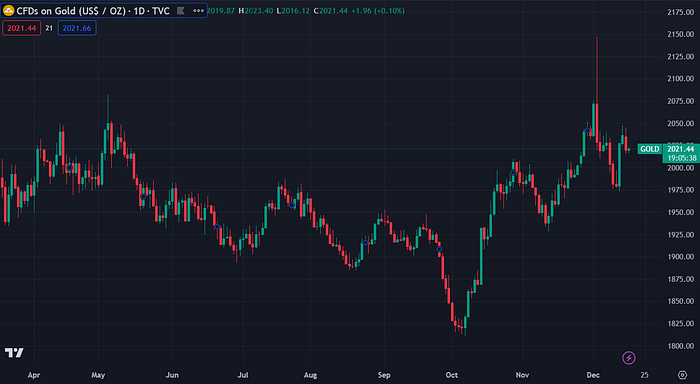 Gold Futures (TradingView)
- Bitcoin Market Data
- MVRV Z score
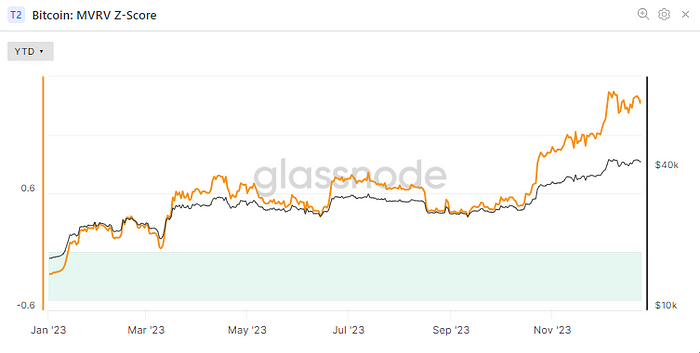
The MVRV Z-score increased from 1.42 to 1.56 last week, indicating a neutral range. It is currently too early to determine whether the market is overheated.
- Indicator explanation: The MVRV Z-score is a measure that determines whether Bitcoin’s market cap is overvalued or undervalued by dividing the difference between Bitcoin’s market cap and realized cap by the standard deviation. If the MVRV Z-score is below 0, Bitcoin can be considered to be undervalued. In the overheated market that reached the All-Time High (ATH) in 2021, scores of 6 or higher were shown.
 Bitcoin: MVRV Z Score(Glassnode)
- aSOPR
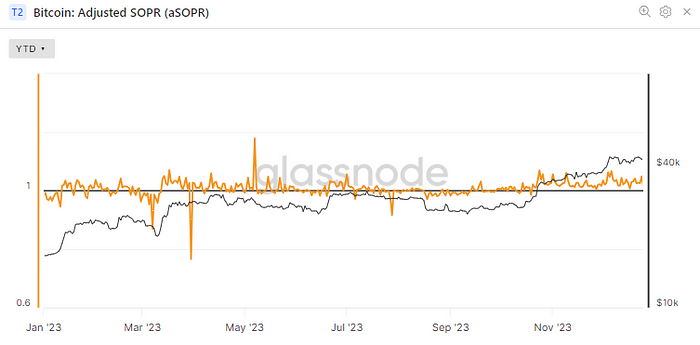
The aSOPR stood at 1.013, a slight increase from 1.007 the previous week. The aSOPR consistently remaining above 1 suggests that the market is still in a bull market.
*aSOPR is short for Adjusted Outfit Profit Ratio, a value obtained by dividing the price of received bitcoin in the past by the price at the time of transmission. When SOPR is less than 1, it indicates a downtrend, and when it is above 1, it indicates an uptrend. aSOPR is a more accurate value that removes meaningless transactions within the hour for adjustments.
 Adjusted SOPR (Glassnode)
- Open Interest
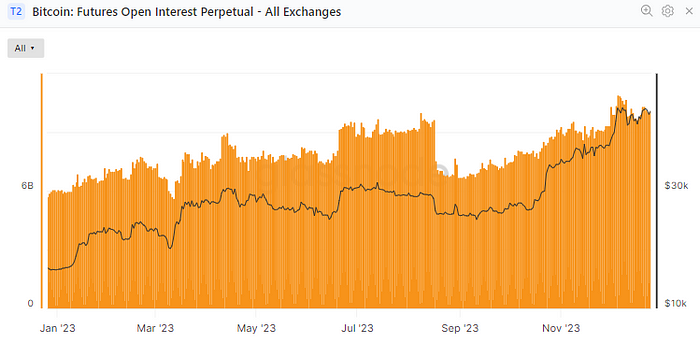
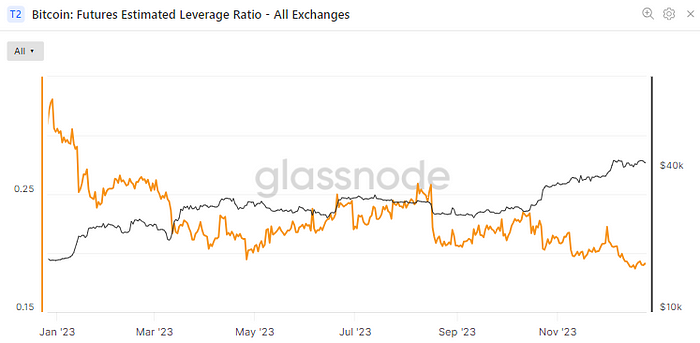
The combined open interest in perpetual futures has surged to $10.1 billion, signaling a notably high level. Historically, there has been a correction whenever open interest in perpetual futures exceeded $9 billion this year. Additionally, open interest in Bitcoin futures on the Chicago Mercantile Exchange (CME) has hit an all-time high, raising concerns about a correction due to open interest unwinding. However, the combined estimated leverage ratio across exchanges is relatively low at 0.191, suggesting that this influx of funds into the futures market may be interpreted as significant. Despite the elevated open interest, the simultaneous increase in collateral suggests the possibility of a short-term correction resulting from open interest unwinding rather than a crash due to liquidation.
 Outstanding Open Interests by Exchanges (Glassnode)
 Exchanges’ combined estimated leverage ratio (Glassnode)
- On-chain data
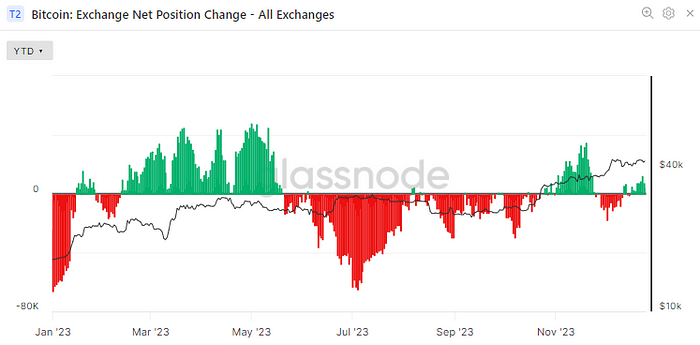
- Exchange inflows and outflows
Bitcoin positions on exchanges have experienced modest inflows. While it is essential to exercise caution regarding such inflows, as they may contribute to selling pressure, the current inflows are relatively modest when compared to the average inflows throughout the year. Consequently, the likelihood of a minor correction is more probable than a significant crash resulting from spot selling.
 Bitcoin: Exchange Net Position Change(Glassnode)
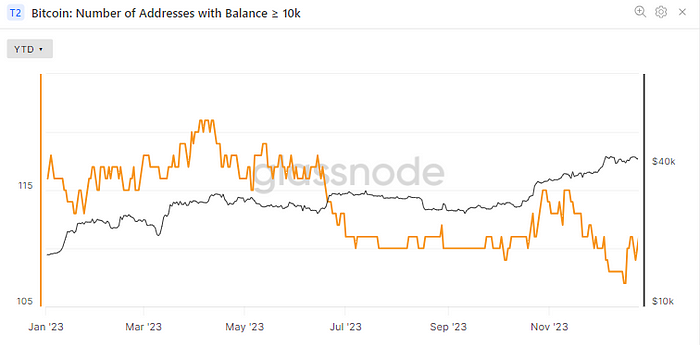
- Number of Whale Wallets
The number of whale wallets, each holding more than 10,000 Bitcoin, has rebounded, suggesting a potential halt to the decline attributed to short-term profit-taking. At the current price level, this rebound may indicate that some whales have expanded their Bitcoin holdings. Given the historical trend where the number of Bitcoin whale wallets tends to precede Bitcoin price movements, any further increase in the count of whale wallets could be considered a positive signal for Bitcoin prices in the upcoming year.
 Number of Bitcoin wallets holding 10K or more (Glassnode)
- Last Week’s Major News
- Bitcoin fees reach the highest level in two years due to the popularity of Ordinals
Bitcoin network fees have surged to the highest levels in over two years, driven by the widespread popularity of Ordinals, as reported by CoinDesk on the 18th (local time). According to data from BitcoinInfoCharts, the average transaction cost on the Bitcoin blockchain rose to $37 the previous day, marking the highest level since April 2021. Bitcoin network fees averaged between $1 and $2 in September and early October. The main factor behind the rise in Bitcoin fees is the renewed popularity of Ordinals. Ordinals are protocols that allow storing non-fungible tokens (NFTs) on the Bitcoin blockchain. Users created over 1.2 million new Ordinal inscriptions from the 15th to the 17th, leading to congestion on the Bitcoin network, with approximately 300,000 transactions waiting to be confirmed
- Bitcoin CME Open Interest at an All-Time High
CoinDesk reported on the 19th that, citing data from DoubleBlock, CME Bitcoin options open interest reached a historic high, approaching $2 billion. CoinDesk explained that the increase in open interest is attributed to high liquidity and significant participant interest. According to data from the analytics platform CoinGlass, the open interest for options expiring at the end of December is tilted towards the sell side, with 65% long positions compared to 35% short positions. When the trading volume of long positions exceeds that of short positions, it is interpreted as an indicator of bullish sentiment.
- Stacks surges 27% on Tim Draper comments
Stacks (STX), the native token of the Stacks network, surged over 26% on the 20th, fueled by positive comments from legendary investor Tim Draper, as reported by CoinDesk. As of the 25th, Stacks is trading at around $1.50, the highest level since February 2022. Stacks is a Layer 2 network designed to execute smart contracts on Bitcoin. The STX token was initially supplied through the first token offering that complied with the standards of the U.S. Securities and Exchange Commission (SEC) in 2019.
- Major economic events
- Major economic events last week
The U.S. economic data from last week indicated lower inflation and effective price containment. U.S. stocks and asset markets experienced a year-end rally, driven by inflation data that included figures from the core consumer price index and the core personal consumption expenditures index, both of which fell below expectations.
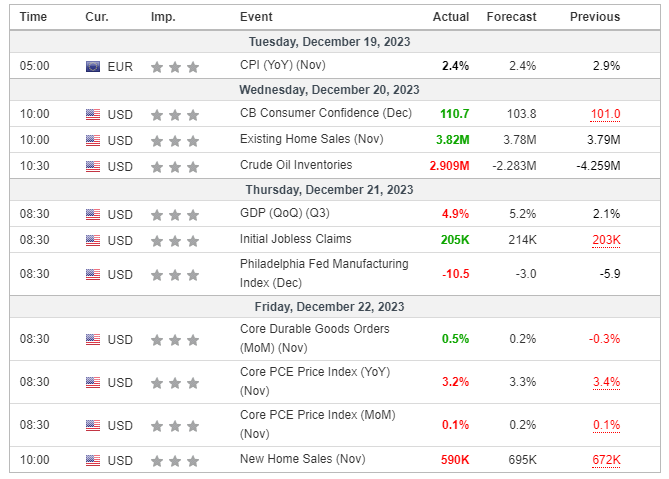 Major Economic Events for the 3rd week of December 2023 (Investing.com)
- This week’s major economic events
This week is relatively uneventful due to the Christmas and New Year’s holidays. The main data points to watch for price movements are the US unemployment claims and crude oil inventories. If these data align reasonably with expectations, it is anticipated that the end of the year will transpire without significant volatility in asset markets.
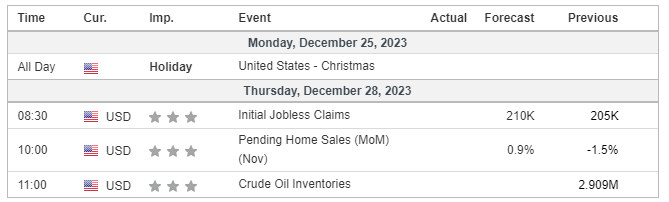 Major Economic Events for the 4th week of December 2023 (Investing.com)
Summary
Positive indicators: US bond rates, US dollar index, NASDAQ100, gold futures, aSOPR, whale wallet count
Negative indicators: Mt. Gox Redemption, Bitcoin Dominance, and Open Interest in Perpetual Futures
**Overall Review: **The recent rumors of a Mt. Gox redemption have triggered a minor correction in Bitcoin, causing a short-term downtrend. Nevertheless, U.S. inflation seems to be under control, and with anticipated interest rate decreases, U.S. stocks and gold futures are on the rise. As a result, there is an expectation of a positive macro trend for Bitcoin and other cryptocurrencies. However, it’s important to remain cautious, considering that Bitcoin’s open interest has significantly increased, leaving room for a potential short-term correction at any moment.