Announcements
Media
League of Traders Weekly Report (5th week of May 2024)
League of Traders EN
|
May 28, 2024 02:39 (UTC+0)
The Weekly Report is our summary of key indicators and recent events in the crypto world that professional traders are closely monitoring. This report and other relevant information are first shared via the official League of Traders Telegram channel.
Here are our notes for the fifth week of May!
- Bitcoin Chart/Ethereum Chart
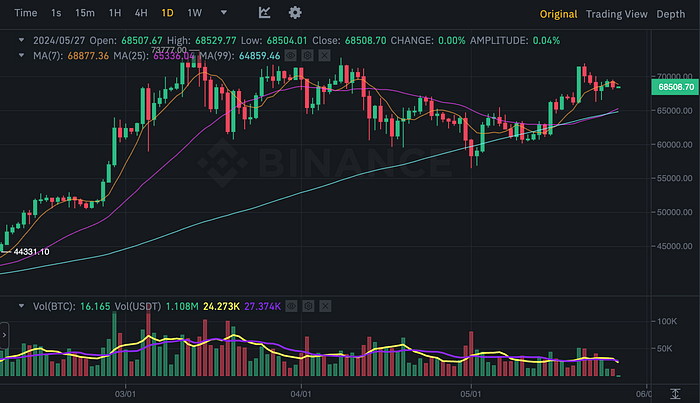
Last week, Bitcoin’s price surpassed $71,000, driven by expectations of the approval of the Ethereum spot ETF, but then slightly declined and stabilized at $68,500. Technically, it is now closer to its previous high resistance level of $73,000 rather than the lower support level of $61,000.
Following the approval of the Ethereum spot ETF, optimism about Bitcoin remains strong among many experts. Analysts suggest that the current positive factors are still valid. The recent rise in the value of Bitcoin has been influenced by an improved macroeconomic environment, anticipated fund inflows into Bitcoin spot exchange-traded funds (ETFs), and the listing of the Ethereum ETF. Geoff Kendrick, Bank Head of FX Research and Digital Assets Research, stated “I would expect a fresh all-time high in bitcoin by the weekend, through the 14 March $73,798 level”. He also projected a potential price of $150,000.
 BTCUSDT Chart (Binance)
The inflow of funds into Bitcoin has shown a positive trend, notably from BlackRock’s IBIT, which holds the largest assets under management among Bitcoin spot ETFs in the United States. According to the ‘13F Report’ submitted to the US SEC, nearly 2,000 institutions have invested in Bitcoin spot ETFs this year. Additionally, HODL Capital reported that 14,389 bitcoins flowed into spot ETFs. If institutional participation continues, Bitcoin’s future outlook appears promising.
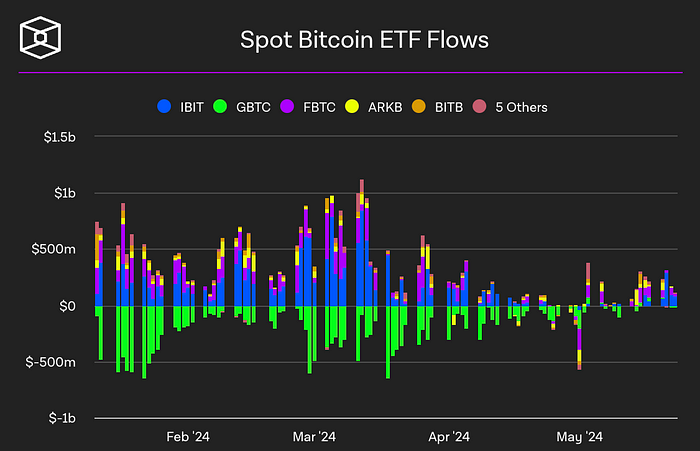 Spot Bitcoin ETF flow (The Block)
Contrary to previous expectations, the Ethereum spot ETF surged over 20% last week following its approval as the first altcoin ETF by the SEC. The SEC’s approval of the 19b-4 document, which is a formal review request for ETFs, does not immediately permit trading. It may take several weeks or months to approve the S-1 securities report, so trading has not yet begun. However, positive movement in Ethereum’s price is likely until the spot ETF trading begins. CoinGraph predicted an increase in ETH’s price based on three indicators: open interest, preference for Ethereum over Bitcoin, and rising demand for ETH.
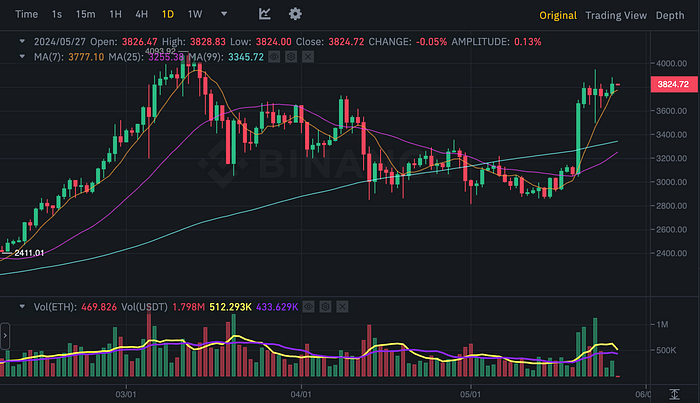 ETHUSDT Chart (Binance)
Bitcoin dominance fell to 54.18% from 56.03% last week due to the significant rise in Ethereum, which currently leads the altcoin market. This year, Bitcoin’s dominance over market capitalization has remained within 53–57%. As anticipation for the Ethereum spot ETF continues, Bitcoin dominance might converge toward 53% before trading begins.
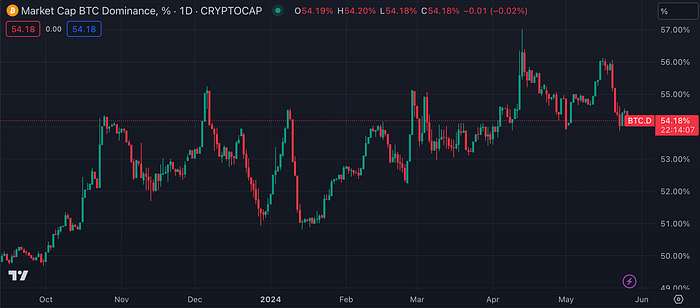 Bitcoin dominance chart (CoinMarketCap)
2. Major Economic Indicators
- US Bond Yields
The US 10-year bond yield increased slightly from 4.416% last week to 4.467% this week, largely due to the release of the FOMC meeting minutes. The minutes revealed that members of the Federal Reserve hinted at the possibility of prolonged high interest rates. They stated that the current interest rate is insufficient to bring prices down to the target level of 2%, making it necessary to maintain the current rate for the time being. Some officials also suggested that rates could be raised more if needed, dampening market expectations of an imminent rate cut.
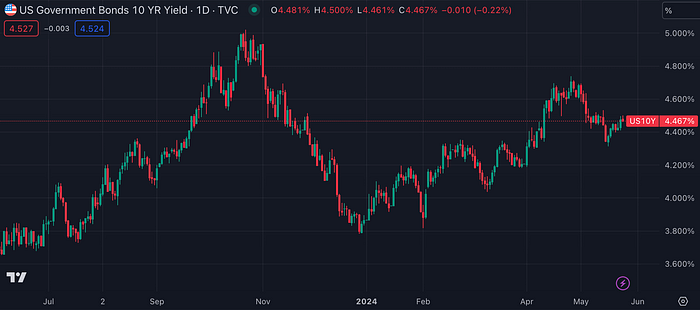 US10YPrice Government Bond Rate (TradingView)
- US Dollar Index
The US dollar index also saw a modest rise, moving from 104.486 last week to 104.703 this week. Recently, it has been tracking the movement of US bond yields closely. Unless there is a significant change in the international situation, the dollar index is expected to continue moving in tandem with bond yields.
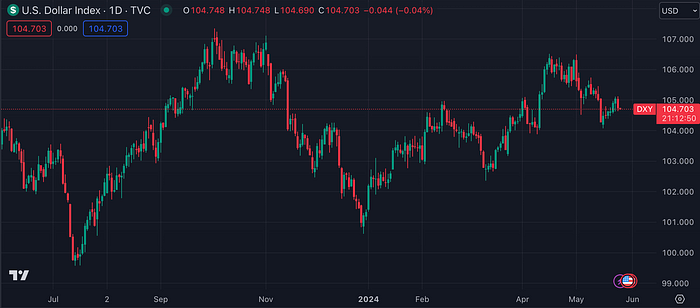 US Dollar Index (TradingView)
- US100 (Nasdaq 100)
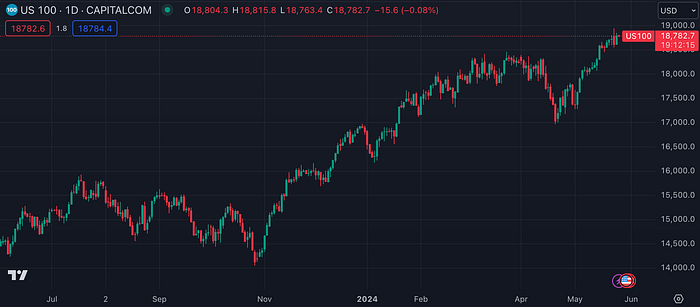
The US100 index continues its rise, going from last week’s 18,576 to this week’s 18,782. Global stock markets, including those in the United States, are performing well. The Dow Jones Industrial Average surpassed 40,000 for the first time, while the S&P 500 and Nasdaq 100 also hit new highs last week. Stock indices in Europe, Canada, Brazil, India, Japan, and Australia are at or near all-time highs.
This optimism is driven by expectations that the Federal Reserve will ease monetary policy this year, amid hopes that the economy will achieve a soft landing despite inflation. Additionally, enthusiasm for AI (artificial intelligence) has boosted the market. Five major companies — NVIDIA, Microsoft, Amazon, Meta, and Alphabet (Google’s parent company) — accounted for about 53% of the increase in stock prices. The rise in technology stocks, which have been affected by Bitcoin’s performance this year, is likely to impact virtual assets positively.
 US100 (TradingView)
- Gold Futures
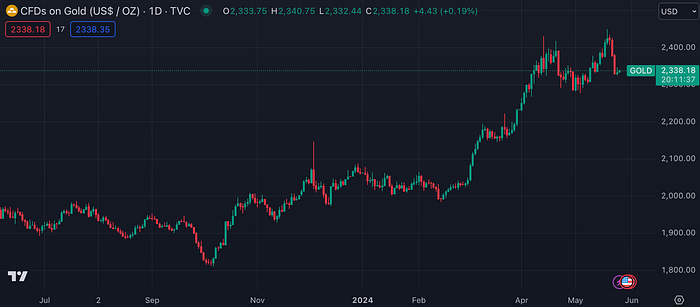
As US Treasury yields rebounded, gold futures experienced a sharp correction, falling from $2,432 last week to $2,338 this week. The release of the Federal Reserve’s meeting minutes, which reinforced concerns about a ‘higher for longer’ monetary policy, caused a significant drop in interest rates last week. The price of gold plunged by more than $50 in a single day on the 24th, marking the largest decline in about eight months. Until US Treasury yields trend downward again, gold prices may remain sideways or continue to weaken further.
 Gold Futures (TradingView)
3. Bitcoin Market Data
- MVRV Z-score
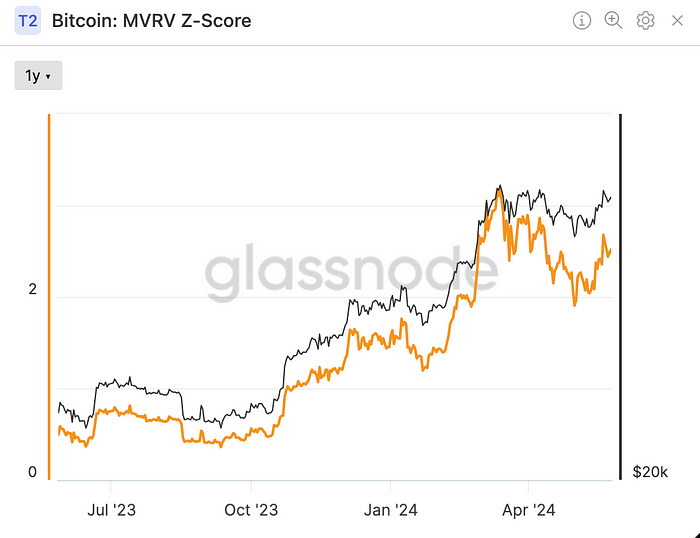
The MVRV Z score increased from 2.35 last week to 2.46 this week, indicating that Bitcoin is entering a moderately overheated zone in the mid-range of the current rally.
- Indicator explanation: The MVRV Z-score is a measure that determines whether Bitcoin’s market cap is overvalued or undervalued by dividing the difference between Bitcoin’s market cap and realized cap by the standard deviation. If the MVRV Z-score is below 0, Bitcoin can be considered to be undervalued. In the overheated market that reached the All-Time High (ATH) in 2021, scores of 6 or higher were shown.
 Bitcoin: MVRV Z Score (Glassnode)
- aSOPR
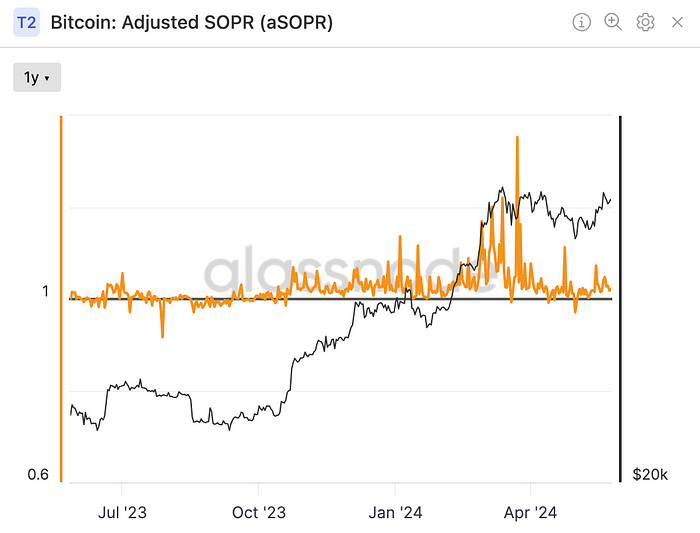
The aSOPR rose to 1.027 from 1.017 last week. Since this value has been consistently over 1 for the past week, the bull market is likely to continue.
- aSOPR is short for Adjusted Spent Outfit Profit Ratio, a value obtained by dividing the price of received bitcoin in the past by the price at the time of transmission. When SOPR is less than 1, it indicates a downtrend, and when it is above 1, it indicates an uptrend. aSOPR is a more accurate value that removes meaningless transactions within the hour for adjustments.
 Adjusted SOPR (Glassnode)
- Open Interest
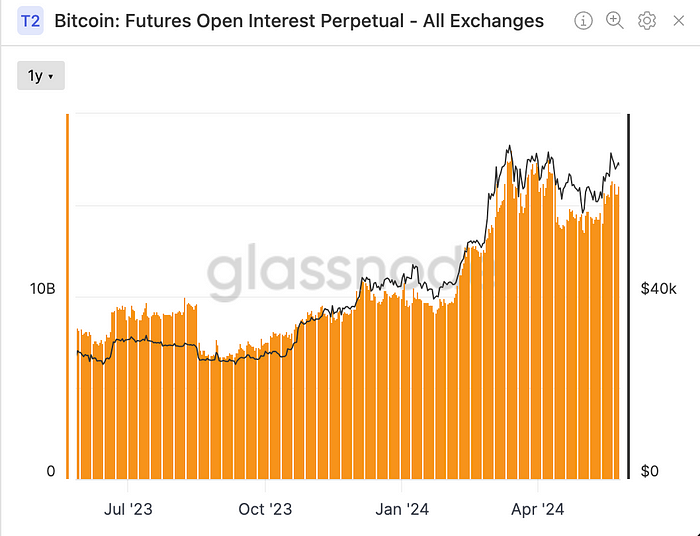
Bitcoin’s combined perpetual futures open interest on exchanges rose from $15.50 billion last week to $15.88 billion this week, while the estimated leverage ratio slightly decreased from 0.185 to 0.180. This decrease in the leverage ratio, despite the increase in open interest, suggests a healthy influx of funds into the perpetual futures market and is a positive indicator for future market growth due to expanded positions.
 Outstanding Open Interests by Exchanges (Glassnode)
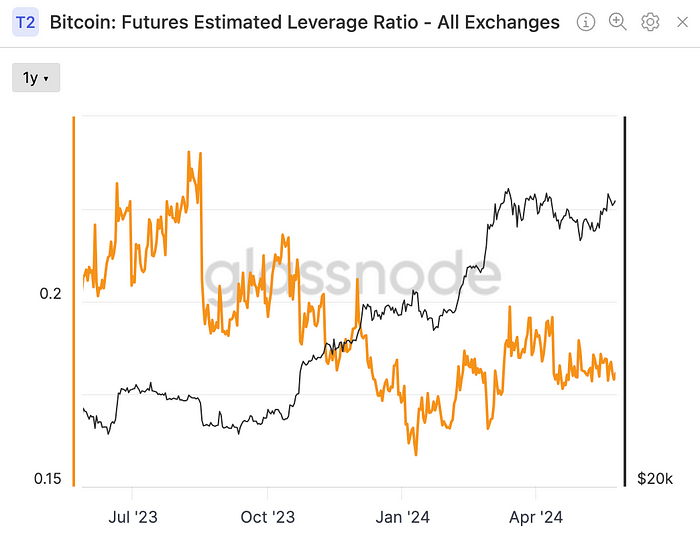 Exchanges’ combined estimated leverage ratio (Glassnode)
4. On-chain data
- Exchange inflows and outflows
Bitcoin holdings at exchanges, which showed an outflow advantage last week, are now mixed. Both net inflows and net outflows are minimal, indicating a neutral state.
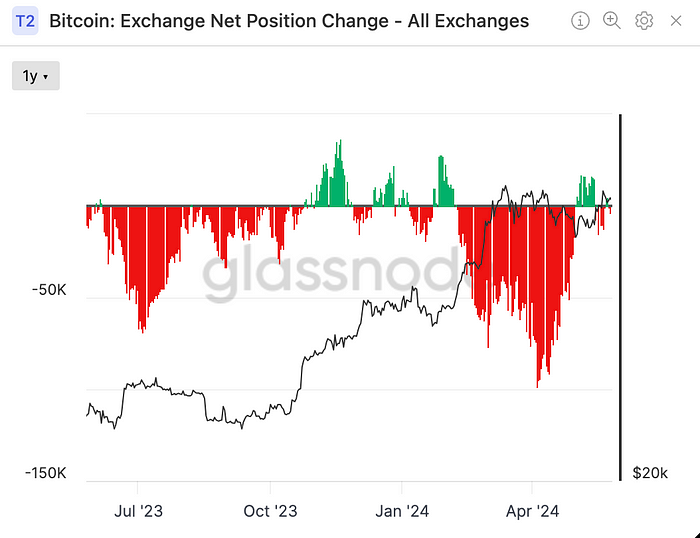 Bitcoin: Exchange Net Position Change (Glassnode)
- Number of Whale Wallets
The number of whale wallets holding more than 10,000 Bitcoin remains unchanged despite the rise in Bitcoin’s price. The lack of profit-taking activity among whales suggests their target price is higher than the current market value, indicating confidence in more price increases.
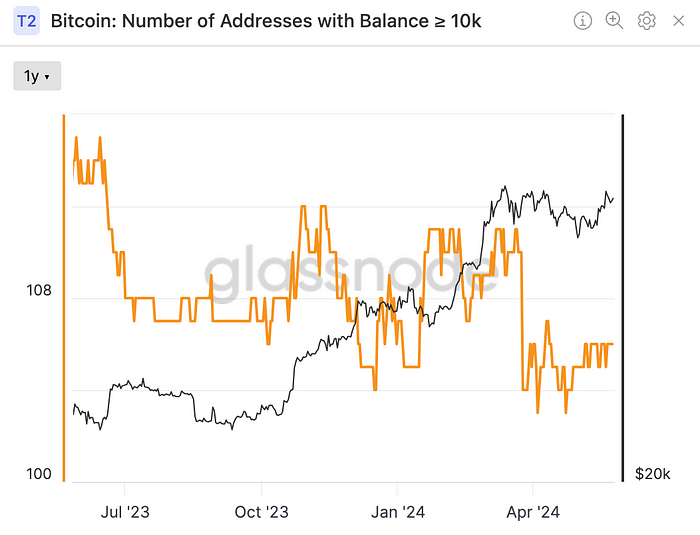 Number of Bitcoin wallets holding 10K or more (Glassnode)
5. Last Week’s Major News
- SEC approves listing of Ethereum spot ETF
The U.S. Securities and Exchange Commission (SEC) has approved the listing of the Ethereum (ETH) spot ETF submitted by global asset managers, including VanEck, on the 23rd. This comes four months after the approval of the Bitcoin (BTC) spot ETF in January, marking the first approval of a spot ETF for an altcoin.
- FOMC meeting minutes show rising inflation concerns and a lack of confidence in interest rate cuts
The minutes from the FOMC meeting held April 30 to May 1, released on the 22nd, highlighted growing concerns about inflation among members. The minutes also revealed a lack of confidence in the feasibility of cutting interest rates, with policymakers expressing uncertainty about the timing of potential rate reductions.
- The power of community… Yuga Labs “Hands Off Crypto Punk NFT”
Yuga Labs faced strong backlash from the CryptoPunk community after hastily becoming involved in the Super Punk World NFT project. In response, Yuga Labs announced it would no longer interfere with the CryptoPunk collection. This incident underscores the power of NFT communities in shaping the business strategies of centralized companies.
6. Major economic events
- Major economic events last week
Last week, the most significant events were Chairman Powell’s speech and the release of the FOMC meeting minutes. However, due to U.S. Federal Reserve Chairman Jerome Powell contracting COVID-19, his speech was recorded, and attention shifted to the FOMC meeting minutes. These minutes showed ongoing concerns about inflation, causing U.S. bond yields to rebound. Additionally, new unemployment claims fell below forecasts, indicating strong employment, and both the manufacturing and services purchasing managers’ indices exceeded expectations, further highlighting persistent inflation worries.
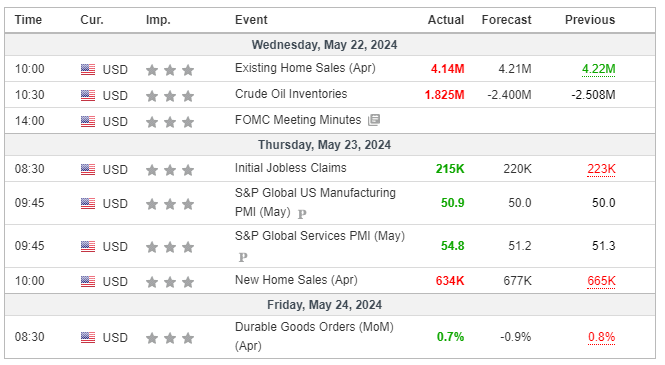 Major Economic Events for the 4th week of May 2024 (Investing.com)
This week’s major economic events
This week, the release of U.S. and European consumer price indices is highly anticipated. If these indices fall below forecasts, indicating rising prices, it could trigger a rally in asset markets, including the stock market, which has been reaching record highs as of late.
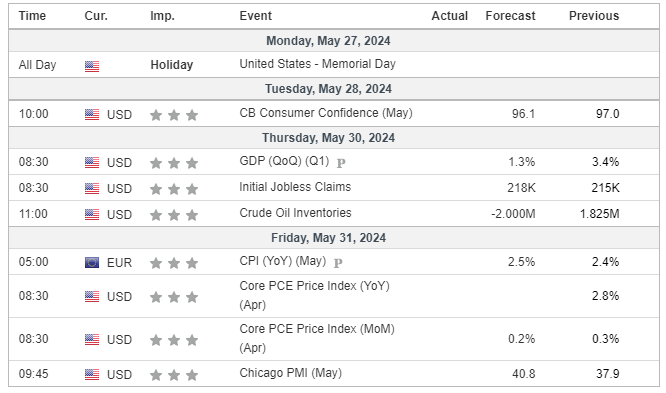 Major Economic Events for the 5th week of May 2024 (Investing.com)
Summary
Positive indicators: Approval of the Ethereum spot ETF, Fund inflows into the Bitcoin spot ETF, US100 index, MVRV Z-score, aSOPR
Negative indicators: Treasury yields, U.S. dollar index, gold futures
Overall Review: Despite the rebound in U.S. interest rates last week, the virtual asset market experienced overall gains, largely due to the approval of the Ethereum spot ETF. Funds are again flowing into the Bitcoin spot ETF, and on-chain indicators such as the MVRV-Z score and aSOPR also show upward trends, suggesting that virtual assets will likely continue their upward trajectory this week. However, if macroeconomic indicators like the personal consumption expenditure price index do not meet expectations, virtual assets may trend sideways or weaken. In such a scenario, buying Bitcoin or major altcoins that have undergone sufficient correction in the spot market, rather than in futures, may prove to be a sound strategy.