Announcements
Media
League of Traders Weekly Report (1st week of June 2024)
League of Traders EN
|
Jun 5, 2024 01:50 (UTC+0)

The Weekly Report is our summary of key indicators and recent events in the crypto world that professional traders are closely monitoring. This report and other relevant information is first shared via the official League of Traders Telegram channel.
Here are our notes for the first week of June!
- Bitcoin Chart/Ethereum Chart
Bitcoin’s price experienced a slight decline, dropping from $68,500 last week to $67,750. U.S. bond yields have not commonly remained weak despite this year’s declines. Bitcoin’s short-term momentum has turned bearish, falling below the 50-day moving average of $65,000, which is a key support line, indicating a bearish sideways trend.
This drop is attributed to 75,000 BTC, approximately $5 billion, being moved from Mt. Gox’s wallet for the first time in five years. Although this turned out to be a routine wallet movement, it indicates that asset distribution to creditors, scheduled for October 31, is imminent. Some experts believe that there are sufficient funds to buy Bitcoin, such as those from a potential Bitcoin Spot ETF, that could absorb the market volume.
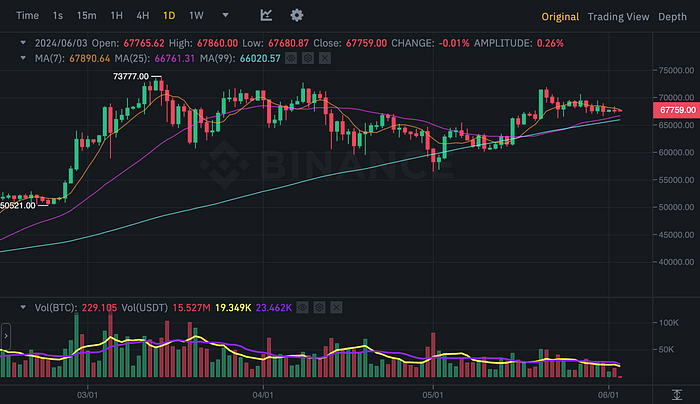 BTCUSDT Chart (Binance)
Funds flowed into BlackRock’s IBIT, the largest Bitcoin spot ETF in the United States by assets under management, while there were outflows from Grayscale’s GBTC. Despite the outflows, the overall inflows outweighed outflows, though inflows were significantly lower compared to February and March when they were most active. Nonetheless, the inflow from BlackRock, the largest fund, is seen as a positive sign.
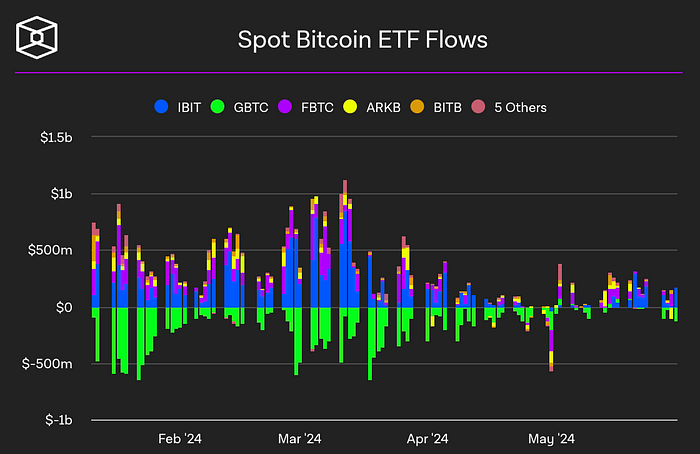 Spot Bitcoin ETF flow (The block)
This week, we saw Ethereum’s price fall from $3,824 to $3,773. As we have previously mentioned, even if a 19b-4 form, a formal review request for a spot ETF, is approved, it could take several weeks to months for the S-1 securities report to be approved. Therefore, there are expectations of fund inflows from the spot ETF, which could positively impact Ethereum’s price.
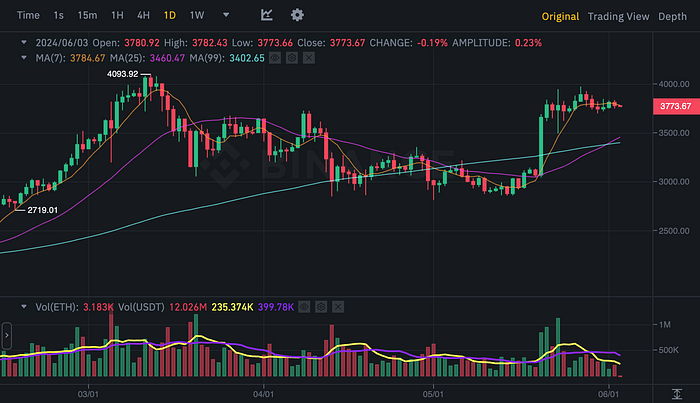 ETHUSDT Chart (Binance)
Bitcoin’s dominance rose slightly from 54.18% last week to 54.58% this week. It had dipped to mid-53% at one point last week but has rebounded to 54%. Since the Bitcoin spot ETF began trading actively, Bitcoin’s dominance has fluctuated between 53% and 57%, and it is expected to stay within this range in the current market without significant changes.
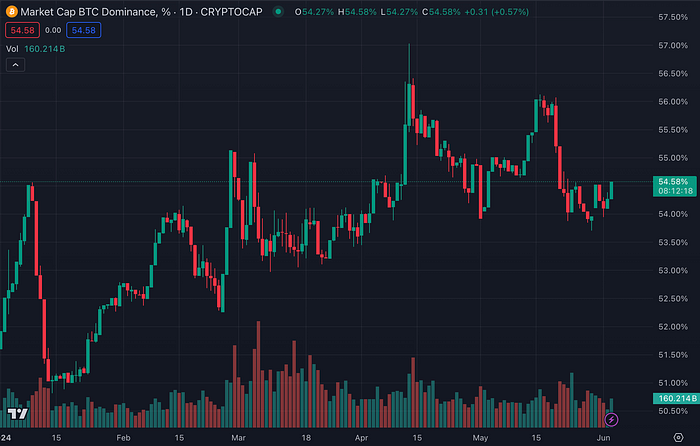 Bitcoin dominance chart (CoinMarketCap)
2. Major Economic Indicators
- US Bond Yields
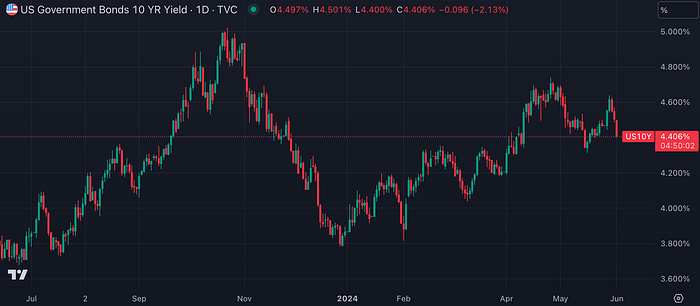
The US 10-year bond yield fell from 4.467% last week to 4.406% this week. As expectations that the Eurozone will preemptively cut interest rates to counter the economic downturn grow, US interest rates are also declining. However, Wall Street experts believe that an interest rate cut in the United States this year is unlikely. US bond yields are expected to become more volatile following the Eurozone interest rate announcement this week and the release of the FOMC dot plot next week.
 US10YPrice Government Bond Rate (TradingView)
- US Dollar Index
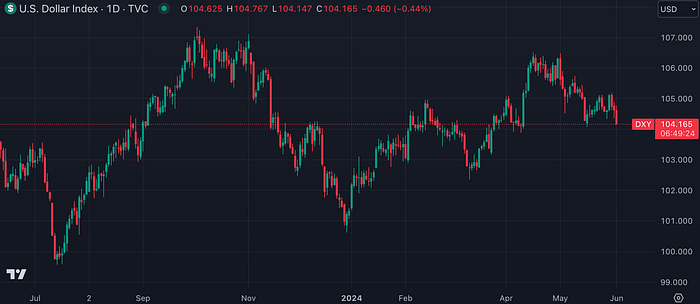
The US dollar index decreased from 104.703 last week to 104.165 this week, mirroring the movement in US bond yields. Market interest rates are anticipated to align with major US employment indicators this week as well.
 US Dollar Index (TradingView)
- US100 (Nasdaq 100)
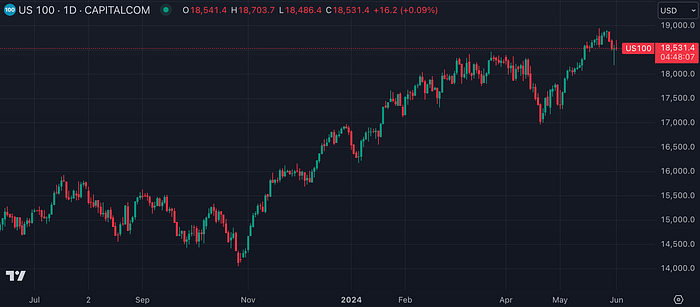
The US100 index fell from 18,782 last week to 18,531 this week. Despite Nvidia’s strong performance ahead of its stock split, declines in other major technology stocks like Tesla dragged the index down. Additionally, a technical glitch at the New York Stock Exchange on the 3rd caused turmoil due to pricing errors at the beginning of the trading day, affecting stocks such as Warren Buffett’s Berkshire Hathaway and Barrick Gold. The US stock market is expected to show mixed or weak performance until the US Federal Reserve’s dot plot announcement next week.
 US100 (TradingView)
- Gold Futures
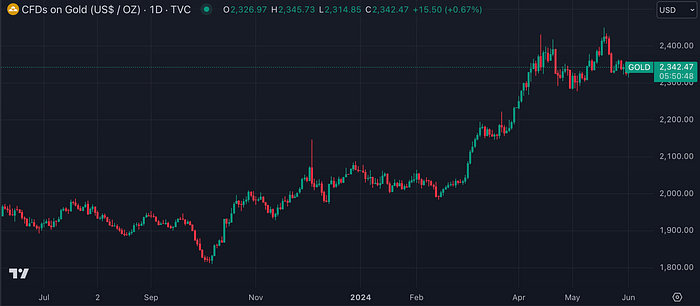
The price of gold futures rose slightly from $2,338 per ounce last week to $2,342 per ounce this week, but the trend remains sideways. The weakness in gold futures prices, despite the decline in US Treasury yields, was unexpected. Some media outlets interpret this weakness as precious metals market participants refraining from making directional bets ahead of key US employment and price indicators.
 Gold Futures (TradingView)
3. Bitcoin Market Data
- MVRV Z-score
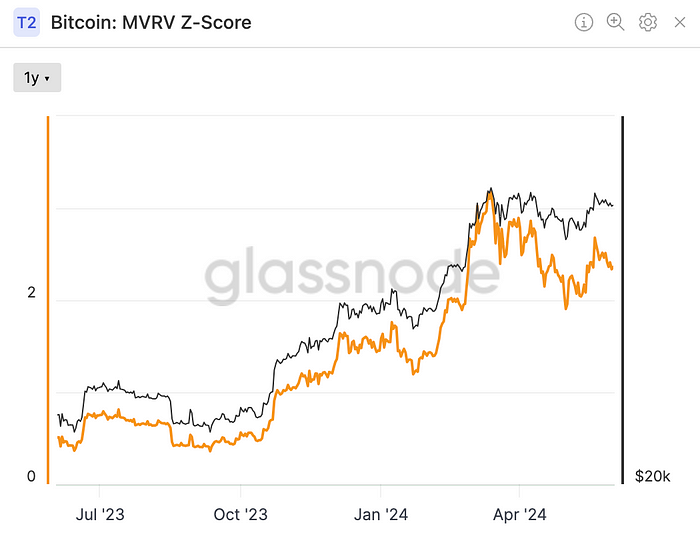
The MVRV Z-score decreased slightly from 2.46 last week to 2.36 this week, indicating no significant change. This figure suggests that Bitcoin has not yet entered the overheating range.
- Indicator explanation: The MVRV Z-score is a measure that determines whether Bitcoin’s market cap is overvalued or undervalued by dividing the difference between Bitcoin’s market cap and realized cap by the standard deviation. If the MVRV Z-score is below 0, Bitcoin can be considered to be undervalued. In the overheated market that reached the All-Time High (ATH) in 2021, scores of 6 or higher were shown.
 Bitcoin: MVRV Z Score (Glassnode)
- aSOPR
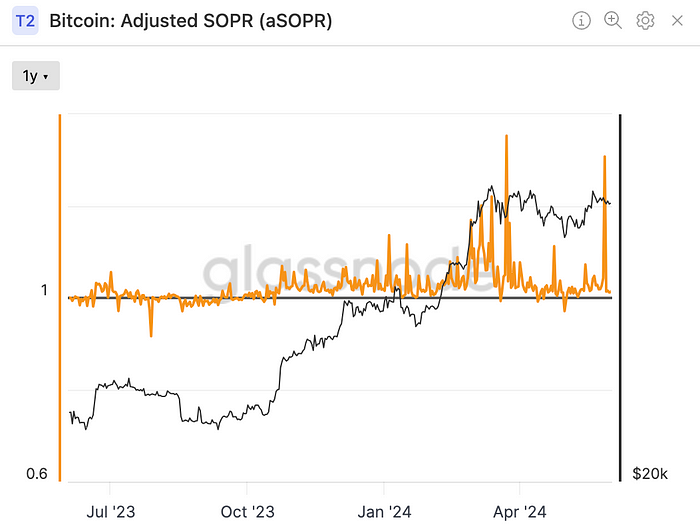
aSOPR recorded 1.027, similar to early last week, indicating that the bull market trend was maintained. However, there were days last week when aSOPR spiked above 1.3. When aSOPR shows a large spike, it’s important to be aware of potential short-term declines in the market, as volatility tends to increase during such events.
- aSOPR is short for Adjusted SpentOutfit Profit Ratio, a value obtained by dividing the price of received bitcoin in the past by the price at the time of transmission. When SOPR is less than 1, it indicates a downtrend, and when it is above 1, it indicates an uptrend. aSOPR is a more accurate value that removes meaningless transactions within the hour for adjustments.
 Adjusted SOPR (Glassnode)
- Open Interest
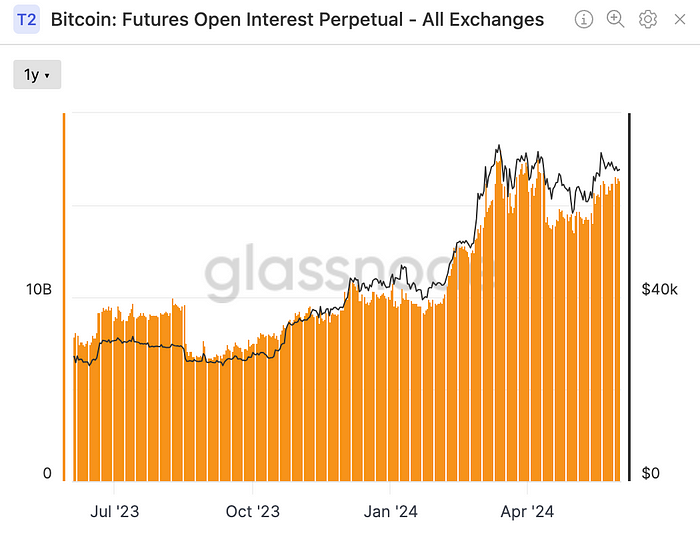
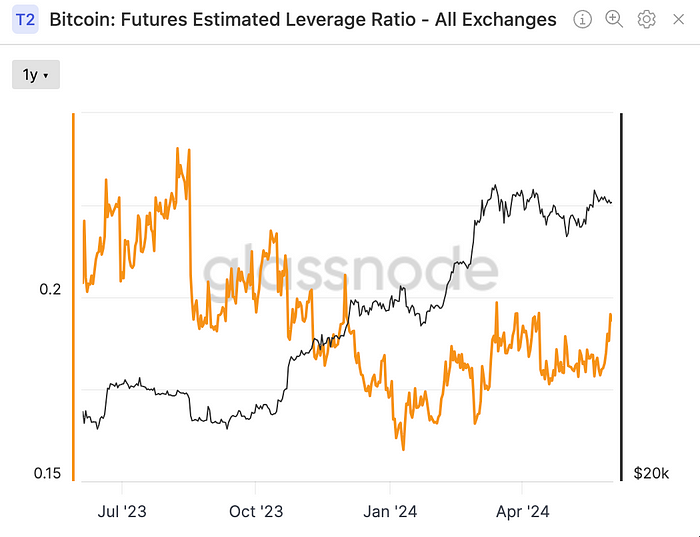
Bitcoin’s combined perpetual futures open interest rose from $15.88 billion last week to $16.42 billion this week. Notably, the estimated leverage ratio also increased significantly from 0.180 to 0.193, raising the risk level.
 Outstanding Open Interests by Exchanges (Glassnode)
 Exchanges’ combined estimated leverage ratio (Glassnode)
4. On-chain data
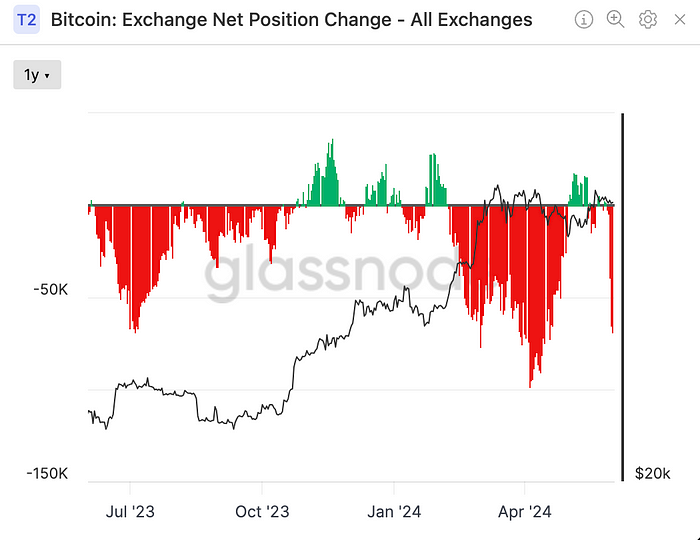
- Exchange inflows and outflows
There were large outflows of Bitcoin from exchanges. Some analysts predict a potential rise in Bitcoin prices due to supply shortages, noting that holdings on exchanges and by miners have fallen to an all-time low.
 Bitcoin: Exchange Net Position Change (Glassnode)
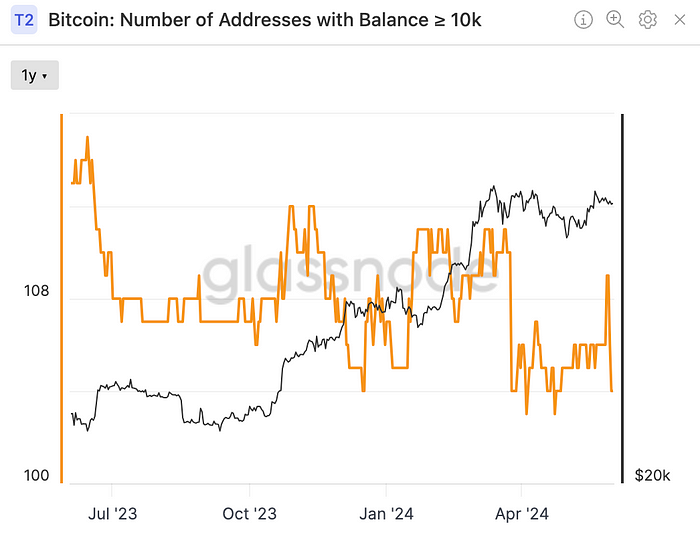
- Number of Whale Wallets
The number of whale wallets holding more than 10,000 Bitcoin has dropped significantly, contrary to reports that new Bitcoin whales are accumulating supplies in 2024. Existing Bitcoin whales are slowly realizing profits or managing their holdings by dividing or moving wallets. Meanwhile, new Bitcoin whales are becoming a significant force by increasing their accumulation in some wallets. If, as CryptoQuant CEO Joo Ki-young claims, these whales are building over the counter, this suggests a handover phenomenon among Bitcoin whales.
 Number of Bitcoin wallets holding 10K or more (Glassnode)
5. Last Week’s Major News
- Digital Asset Investment Products Show Positive Trend for Four Consecutive Weeks with $2 Billion Net Inflow in May
Digital asset investment products have experienced a positive trend for four consecutive weeks, with a cumulative net inflow of nearly $2 billion in May. According to the CoinShares weekly report shared on the 3rd, there was an inflow of $185 million into all cryptocurrency funds in the week leading up to May 31. Despite a decrease in scale, the positive trend continued for four weeks, resulting in cumulative net inflows for May totaling $1.999 billion.
- $3 Billion Withdrawn from Exchanges Following Ethereum ETF Approval
Following the approval of the Ethereum spot ETF, significant amounts of Ethereum (ETH) are being withdrawn from cryptocurrency exchanges. CryptoQuant reported that approximately $3 billion worth of Ethereum was withdrawn, suggesting that investors should anticipate a surge in Ethereum’s price if the spot ETF receives final approval and is launched.
- US Consumer Spending Declines as Wages Stagnate and Savings Deplete
US consumer spending, which had been surprisingly resilient, appears to be losing momentum. According to Bloomberg News, real disposable income for US households has seen only slight increases over the past year. Additionally, the savings rate has dropped to a 16-month low as the cash reserves accumulated during the COVID-19 pandemic have diminished.
6. Major economic events
- Major economic events last week
The US first-quarter GDP, announced last week, rose by 1.3%, which was lower than the forecasted 1.6%. Additionally, new unemployment claims were reported at 219,000, higher than expected, indicating overall deterioration in the US economy. Consequently, US Treasury interest rates have fallen, but the asset market has not been rising proportionally and is instead showing signs of weakness.
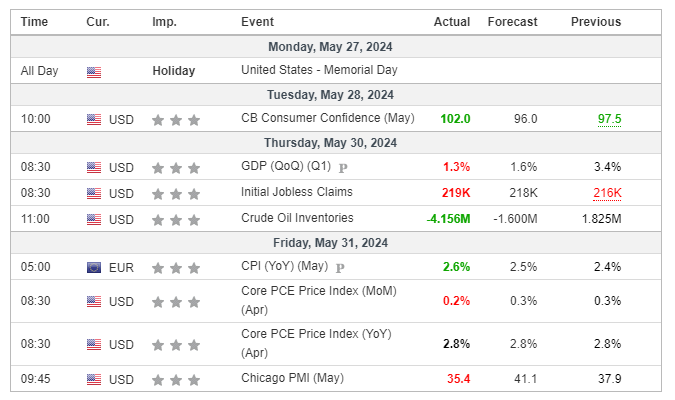 Major Economic Events for the 5th week of May 2024 (Investing.com)
This week’s major economic events
This week, employment-related indicators, including the US unemployment rate, will be announced. Given that the last major economic indicator pointed to a slowing US economy, a decline in the employment index could suggest that the Federal Reserve may raise interest rates in the near future. A European interest rate decision is also expected this week. In Europe, many believe the European Central Bank may lower interest rates. If this happens, asset markets may rebound in the short term.
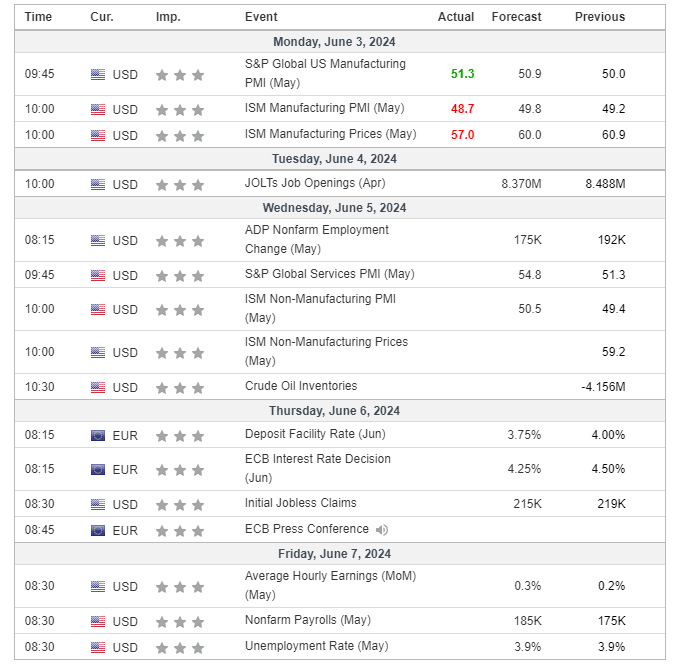 Major Economic Events for the 1st week of June 2024 (Investing.com)
Summary
Positive indicators: US bond yields, US dollar index, Exchange inflows and outflows
Negative indicators: aSOPR, Number of whale wallets, Open interest, and leverage ratio
Overall Review: Although US bond yields and the dollar index have fallen, the prices of major assets, including stocks, have not risen accordingly. The number of Bitcoin whale wallets has decreased, and open interest and leverage ratios have increased on exchanges. This suggests that Bitcoin-related indicators may not be favorable in the short term. Therefore, it would be prudent to refrain from entering new positions and take a wait-and-see approach until the European interest rate decision is made.