Announcements
Weekly Report
Bitcoin Shows Short-term Rebound, Uncertainty Remains: Market Observers Continue to Wait — 3rd Week of March 2025
League of Traders EN
|
Mar 20, 2025 03:02 (UTC+0)

The Weekly Report is our summary of key indicators and recent events in the crypto world that professional traders are closely monitoring. This report and other relevant information are first shared via the official League of Traders Telegram channel.
Here are our notes for the third week of March!
- Bitcoin Chart/Ethereum Chart
Bitcoin, which underwent a significant short-term correction, has rebounded slightly from below $80,000 to $83,000, though the extent and strength of the rebound are not substantial. The outflow of funds from Bitcoin spot ETFs has also eased, with a slight inflow over the past two days. However, President Trump’s tariff policies continue to increase market uncertainty, and investment sentiment remains subdued. Market participants are maintaining a cautious attitude while focusing on the upcoming FOMC meeting.
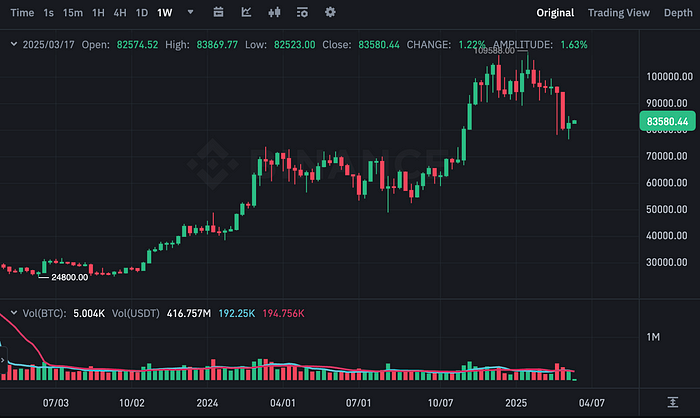 BTCUSDT Chart (Source: Binance)
 Spot Bitcoin ETF flow (Source: The Block)
Ethereum temporarily recovered to $1,900 from the $1,800 range, but the extent and strength of the rebound remain limited. While it lacks clear catalysts to lead an uptrend compared to other cryptocurrencies, the easing of capital outflows from spot ETFs and the fact that it has already undergone a significant correction suggest the possibility of a short-term rebound. However, a cautious approach is necessary as it could be classified as a high-risk asset amid ongoing global economic instability.
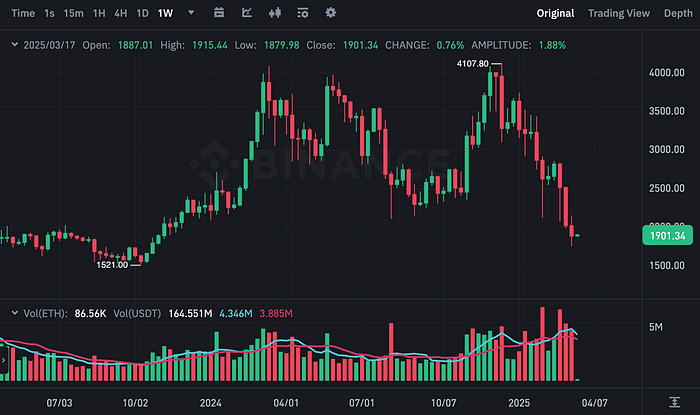 ETHUSDT Chart (Source: Binance)
 Spot Ethereum ETF flow (Source: The Block)
Bitcoin dominance decreased slightly from 61.94% last week to 61.63% this week. This is perceived to be due to the relatively larger rebound of altcoins that had already fallen significantly. However, as altcoins are likely to face larger declines during downturns, it is too early to determine if they are preferred over Bitcoin.
 Bitcoin Dominance (Source: TradingView)
2. Major Economic Indicators
- US Bond Yields
The US 10-year Treasury yield rose slightly from 4.179% last week to 4.278% this week. This reflects relatively positive US employment indicators, which have reduced concerns about a recession. With the FOMC meeting scheduled for this week, there is a possibility of significant volatility related to interest rates.
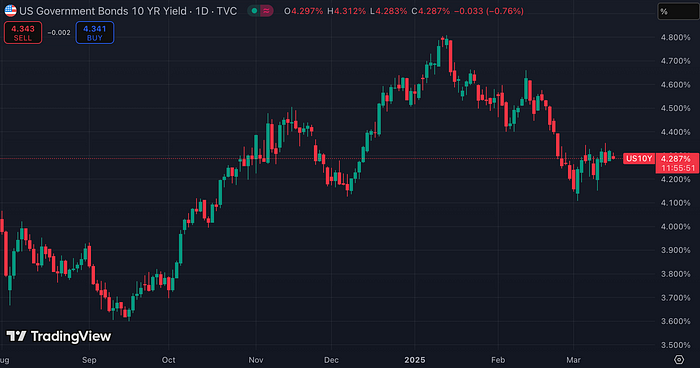 US 10-Year Treasury Yield (Source: TradingView)
US Dollar Index
The US Dollar Index (DXY) remained range-bound, moving from 103.733 last week to 103.597 this week. After a significant decline last week, the dollar index has halted its downward trend and shows signs of rebounding. However, with increasing uncertainty in the international economy and US tariff policies at the center of concerns, the sustainability of a strong dollar remains unclear.
 US Dollar Index (Source: TradingView)
US100 (NASDAQ 100)
The US100 index stopped its decline and rebounded slightly from 19,300 to 19,600. However, uncertainty remains due to US tariff policies, additional monitoring is needed to determine if this represents a trend reversal.
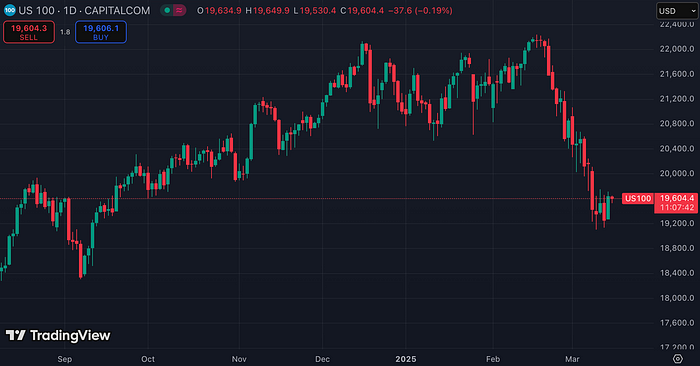 US100 (Source: TradingView)
- Gold Futures
Gold futures rose from $2,894 per ounce last week to $2,995 this week, even exceeding $3,000 per ounce at one point. As market instability continues, the preference for safe-haven assets has increased demand for gold. Consequently, gold is expected to maintain a stable price range for the time being.
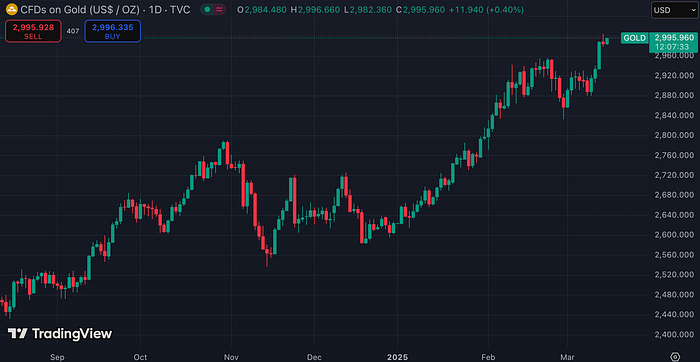 Gold Futures (Source: TradingView)
3. Bitcoin Market Data
- MVRV Z-Score
The MVRV Z-Score increased from 1.66 last week to 1.82 this week. This figure could be interpreted as a signal for a rebound, but additional confirmation is needed as the rebound is not robust. Therefore, while there is potential for a short-term rise, the sustainability of the trend remains uncertain.
Indicator Explanation: The MVRV Z-Score measures the difference between Bitcoin’s market cap and realized cap, divided by standard deviation, offering insight into whether Bitcoin is over- or undervalued. A score below 0 indicates significant undervaluation, while the overheated zone during the 2021 all-time high exceeded 6.
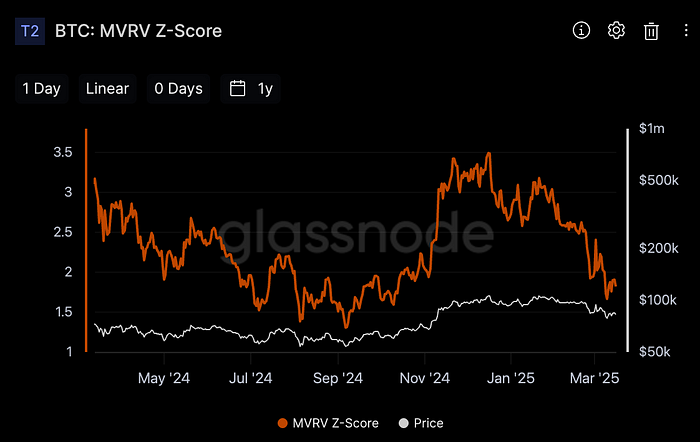 Bitcoin: MVRV Z-Score (Source: Glassnode)
- aSOPR
The aSOPR indicator recovered from 0.995 last week to 1.000 this week. However, since it recorded values below 1 several times during the past week, there is not enough evidence to confirm that the downtrend has concluded.
Indicator Explanation: SOPR (Spent Output Profit Ratio) divides the price of Bitcoin at the time of spending by its price when received. A value below 1 suggests a bear market, while above 1 indicates a bull market. aSOPR refines this by filtering out insignificant transactions within an hour, providing a more precise metric.
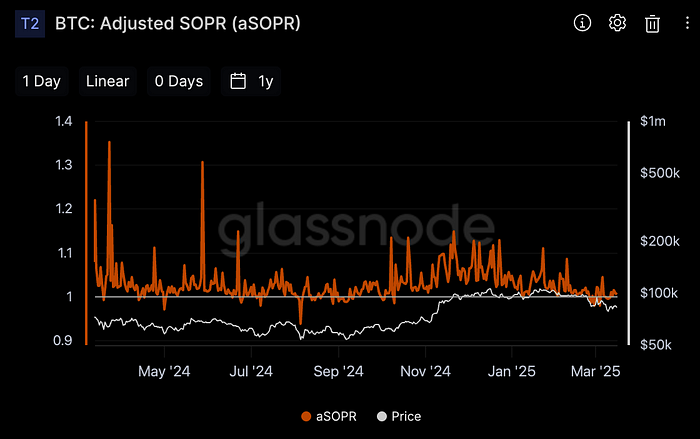 Bitcoin: aSOPR (Source: Glassnode)
- Open Interest
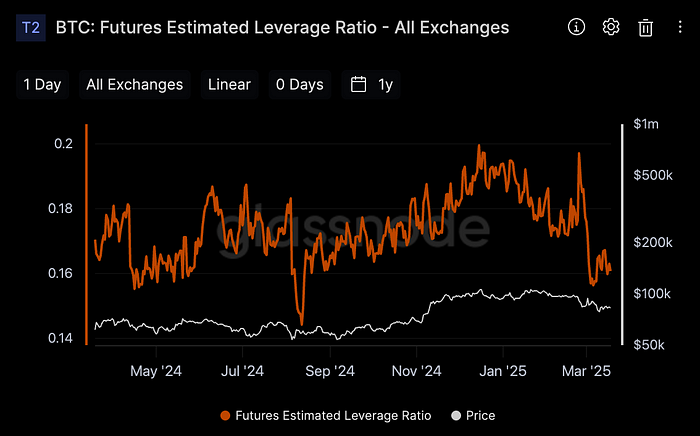
Bitcoin perpetual futures open interest increased slightly from $20.15B last week to $20.82B. Meanwhile, the Estimated Leverage Ratio dropped sharply, returning to last September’s levels. This suggests that market leverage utilization is decreasing and the market is cooling rapidly. Compared to historical figures, the current market risk is assessed as moderate.
 Exchange Aggregate Perpetual Futures Open Interest (Source: Glassnode)
4. On-chain data
- Exchange inflows and outflows
Bitcoin net outflows have occurred again, though due to the insignificant outflow, a trend reversal cannot be declared yet. Additional monitoring of capital flows and market volatility are needed to determine the trend.
![[Bitcoin: Exchange Net Flow (Source: Glassnode)]](https://cdn-images-1.medium.com/max/2000/0*MhAYTv5mqrhHpsla.png?type=webp&quality=100&action=fit) [Bitcoin: Exchange Net Flow (Source: Glassnode)]
[Bitcoin: Exchange Net Flow (Source: Glassnode)]
- Number of Whale Wallets
The number of wallets holding more than 10K Bitcoin has slightly increased, while the number of wallets holding more than 1K has significantly rebounded. We can expect that this will increase the possibility of a short-term rebound. However, if the number of whale wallets decreases again, the market may transition to a downward trend, so continued monitoring is necessary.
![[Bitcoin Wallets with 10K+ Bitcoin (Source: Glassnode)]](https://cdn-images-1.medium.com/max/2000/0*2kW9Gja5XmF-LYpM.png?type=webp&quality=100&action=fit) [Bitcoin Wallets with 10K+ Bitcoin (Source: Glassnode)]
[Bitcoin Wallets with 10K+ Bitcoin (Source: Glassnode)]
![![Bitcoin Wallets with 1K+ Bitcoin (Source: Glassnode)]](https://cdn-images-1.medium.com/max/2000/0*ov534_dv2n2MjLfF.png?type=webp&quality=100&action=fit) ![Bitcoin Wallets with 1K+ Bitcoin (Source: Glassnode)]
![Bitcoin Wallets with 1K+ Bitcoin (Source: Glassnode)]
5. Last Week’s Major News
- OECD Lowers Global Growth Rate from 3.3% to 3.1% Due to Trade War Crisis
In its interim economic outlook report released on March 17, the Organization for Economic Cooperation and Development (OECD) lowered its global economic growth forecast and expressed concern that an intensifying trade war could impact global growth. The OECD projected this year’s global GDP growth rate at 3.1%, down 0.2 percentage points from the 3.3% predicted last December. The OECD also adjusted its growth forecast for 2026 to 3.0%, down 0.3 percentage points from the previous forecast of 3.3%.
- Bitcoin ETF Records Net Inflow for Two Consecutive Days… ETF-led Selling Pressure Decreases
Bitcoin spot ETFs listed on the New York Stock Exchange recorded net inflows for two consecutive days, while Ethereum ETFs continued to see capital outflows. According to Farside Investors on March 18, Bitcoin ETFs recorded an inflow of $274.6 million the previous day, maintaining a positive flow for the second consecutive day. This is the first time since February 7 that Bitcoin ETFs have recorded net inflows for two consecutive days. Funds flowed into five funds, including BlackRock ($42.3 million) and Fidelity ($127.3 million), with no funds experiencing outflows.
- CryptoQuant CEO Expresses Bearish View
CryptoQuant CEO Ki Young Ju stated through his X account that the Bitcoin bull market for this cycle has ended and that a sideways or bear market will unfold over the next 6–12 months. This represents a reversal of Ki’s previous statements. He cited the lack of new capital flows into virtual assets and new whales selling Bitcoin at lower prices as the main reasons for his bearish outlook.
- Key Economic Calendar
Positive US employment indicators last week alleviated recession concerns and provided an opportunity for market rebounds. However, uncertainty due to US tariff policies still remains, and the decline in the Consumer Price Index (CPI) could potentially be interpreted as a signal of economic recession among some pessimists.
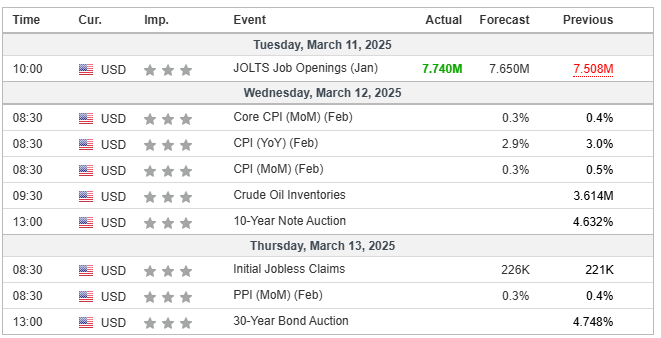 Key Economic Calendar for 2nd Week of March 2025 (Source: Investing.com)
6. Major economic events
Major economic events last week
The FOMC press conference is the most important economic event this week. There is significant interest in whether the Federal Reserve will comment on the asset market decline that has continued since last month.
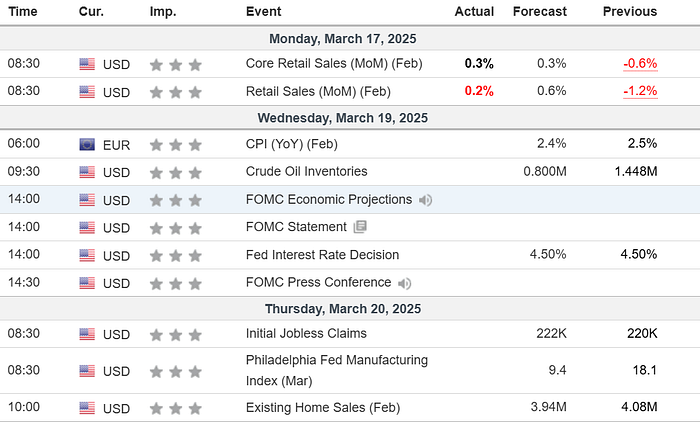 Key Economic Calendar for 3rd Week of March 2025 (Source: Investing.com)
Summary
Negative Indicators: Bitcoin spot ETF, MVRV Z-Score, whale wallet count
Negative Indicators: aSOPR, exchange net flow
Overall Assessment: While a short-term technical rebound has occurred, the strength of various indicators is insufficient to identify this as a trend reversal. Uncertainties such as US tariff policies still remain, and bearish views are emerging among virtual asset market experts. In this situation, it would be advisable to cautiously observe the market.
The FOMC press conference is the most important economic event this week. There is significant interest in whether the Federal Reserve will comment on the asset market decline that has continued since last month.