공지사항
이벤트
US Tariff Policy Announcement Imminent, Focus on Uncertainty Resolution — 1st Week of April 2025
League of Traders EN
|
2025.04.02 08:19 (UTC+0)

The Weekly Report is our summary of key indicators and recent events in the crypto world that professional traders are closely monitoring. This report and other relevant information are first shared via the official League of Traders Telegram channel.
Here are our notes for the first week of April!
- Bitcoin Chart/Ethereum Chart
Bitcoin failed to maintain this past two week’s rebound trend and experienced a correction to $82,000 after facing downward pressure at the $87,000 resistance level. It has since rebounded and currently recovered to the $85,000 level.
With President Trump’s tariff policy announcement scheduled for this week, whether Bitcoin will break through the short-term resistance level of $87,000 or fall below the short-term support level of $82,000 is expected to be a major inflection point in the market.
Meanwhile, the capital flow of Bitcoin spot ETFs is showing a slight outflow without significant changes. This is one of the key variables that will determine the future price movement of Bitcoin, so continuous monitoring is necessary.
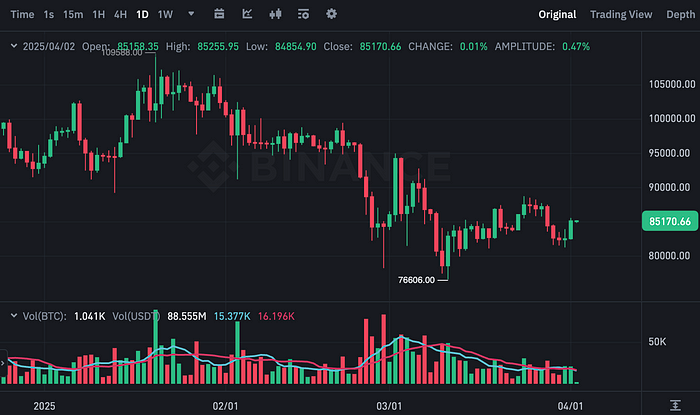 BTCUSDT Chart (Source: Binance)
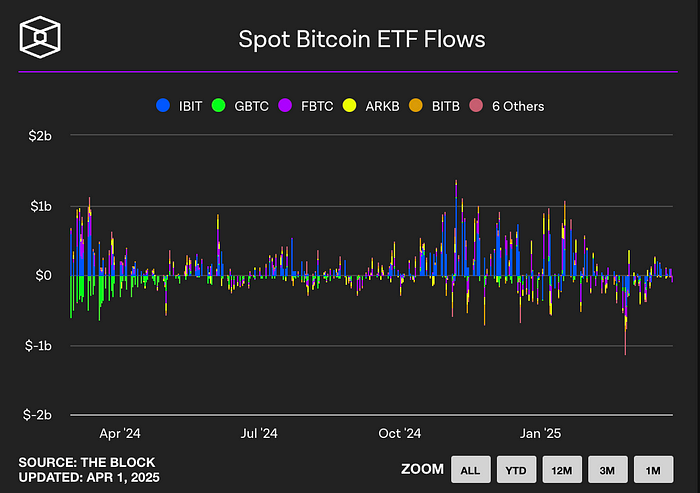 Spot Bitcoin ETF flow (Source: The Block)
Ethereum, which had shown a strong rebound last week maintaining the $2,070 level, fell to $1,890. This decline was primarily due to rumors about a possible Binance delisting, which increased volatility and caused the market to react sharply. It subsequently showed some recovery after Binance founder Changpeng Zhao (CZ) denied these rumors, but the trend still remains sluggish compared to Bitcoin.
Additionally, the capital flow of Ethereum spot ETFs also maintains minimal levels with continued slight outflows, acting as a factor restricting Ethereum’s upward momentum.
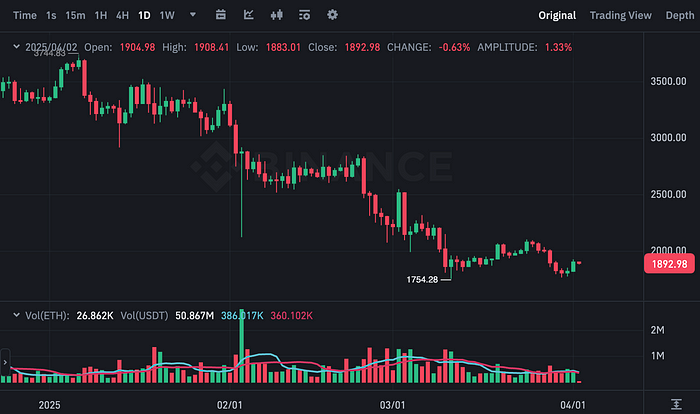 ETHUSDT Chart (Source: Binance)
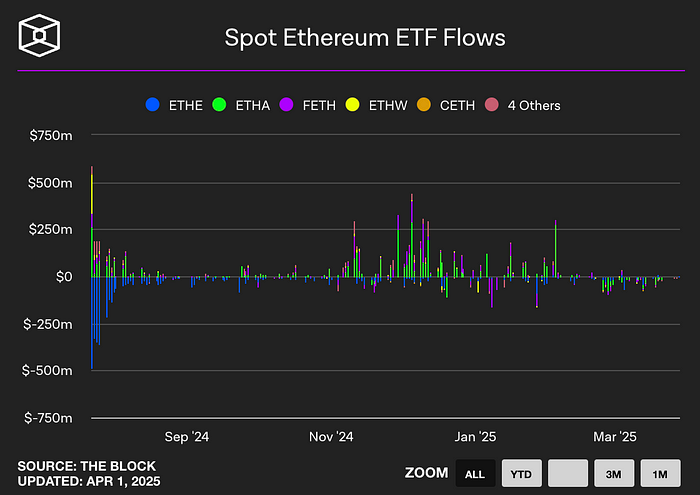 Spot Ethereum ETF flow (Source: The Block)
Bitcoin dominance rose significantly from 61.63% last week to 62.69% this week. This reflects investors moving funds to Bitcoin, which is considered a relatively safe asset, as market uncertainty continues.
In the short term, Bitcoin’s strength is likely to continue, but if the uncertainty triggered by US tariff policy becomes clearer, funds may move to the altcoin market, so careful observation is necessary.
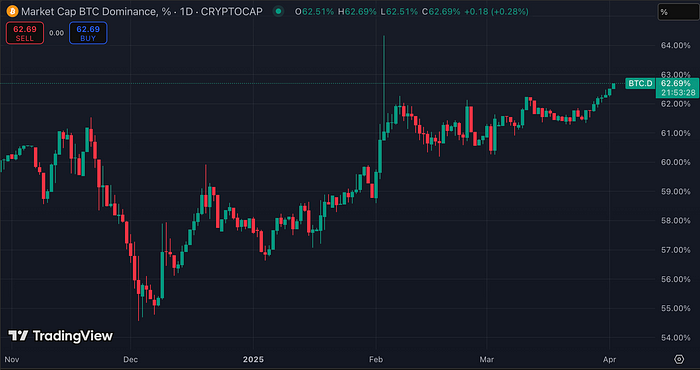 Bitcoin Dominance (Source: TradingView)
2. Key Economic Indicators
- US Bond Yields
The US 10-year Treasury yield fell from 4.277% last week to 4.192% this week. This decline is analyzed as investors preferring safe-haven bonds amid expanded uncertainty about tariff policies. Notably, the gap that rose last week has been filled by the decline. As the Treasury yield is likely to show volatility depending on President Trump’s tariff policy announcement and major US economic indicators, continuous monitoring will also necessary.
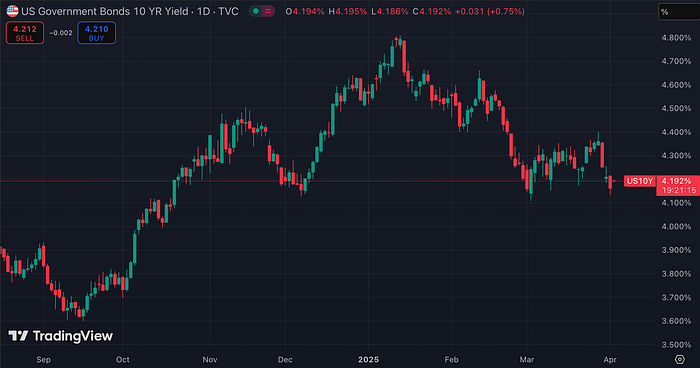 US 10-year Treasury Yield (Source: TradingView)
- US Dollar Index
The US Dollar Index (DXY) rebounded slightly from 103.930 last week to 104.205 this week, but generally maintains a sideways trend. Considering the current market conditions, the dollar index is likely to act as a lagging indicator for major economic issues. Its direction is expected to be determined by future tariff policies and US economic indicator announcements.
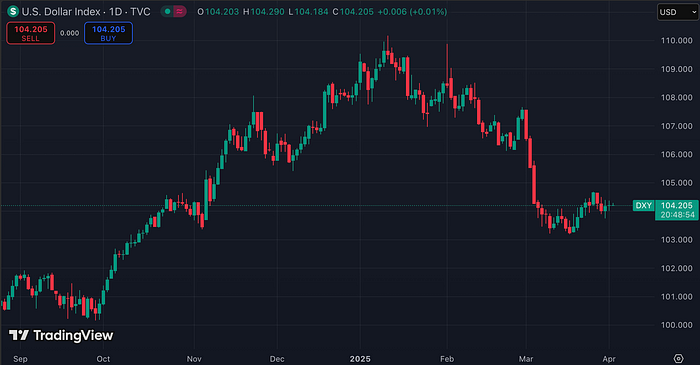 US Dollar Index (Source: TradingView)
- US100
The US100 index fell from just over 20,000 level to the 19,300 level. At one point, it showed a significant decline, falling below the 19,000 level.
Amid deteriorating US consumer sentiment and slowing actual spending, inflation still remains high, and expected inflation has surged. These economic indicators suggest that the US is facing the risk of stagflation (low growth, high prices), and investors have actively sold off accordingly. Although there has been some rebound currently, market uncertainty still exists. Caution is needed regarding volatility due to future US economic indicators and policy changes.
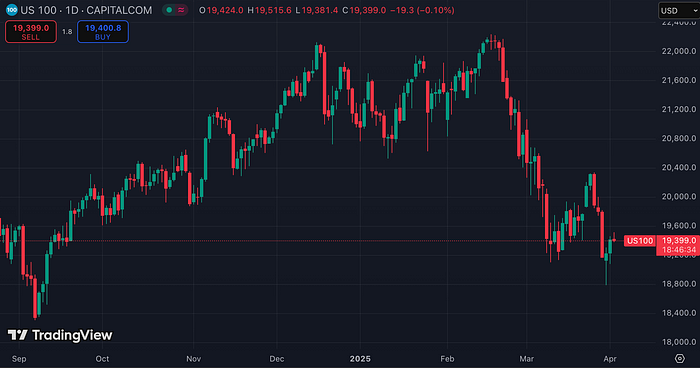 US100 (Source: TradingView)
- Gold Futures
Last week, gold futures prices continued to set all-time highs, rising to $3,130 per ounce. It has been consistently showing strength since December, and the preference for safe-haven assets continues.
However, if the US tariff policy is finalized, market uncertainty may be somewhat resolved, and gold prices may enter an adjustment phase. In this case, it’s worth noting whether the virtual asset market can relatively benefit.
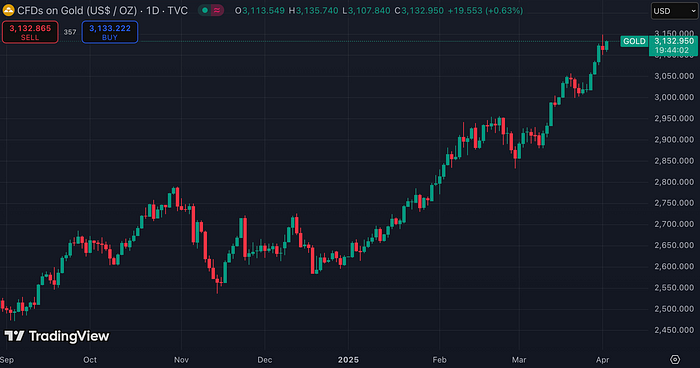 Gold Futures (Source: TradingView)
3. Bitcoin Market Data
MVRV Z-score
The MVRV Z-Score slightly decreased from 1.95 last week to 1.90 this week. Since the decrease is not significant, the current value can be interpreted as indicating a neutral state. Unless the market secures additional upward momentum, the short-term direction appears uncertain.
Indicator Explanation: The MVRV Z-Score measures the difference between Bitcoin’s market cap and realized cap, divided by standard deviation, offering insight into whether Bitcoin is over- or undervalued. A score below 0 indicates significant undervaluation, while the overheated zone during the 2021 all-time high exceeded 6.
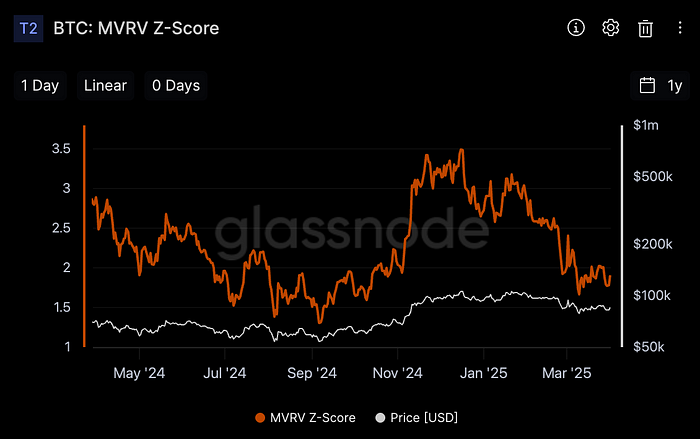 Bitcoin: MVRV Z-Score (Source: Glassnode)
- aSOPR
The aSOPR indicator decreased from 1.008 last week to 0.997 this week, turning to a downward trend. This means that the market has generally shifted from profit realization to accepting losses, which can be interpreted as a typical signal of a downtrend. Therefore, it is necessary to be cautious about the possibility of additional declines.
Indicator Explanation: SOPR (Spent Output Profit Ratio) divides the price of Bitcoin at the time of spending by its price when received. A value below 1 suggests a bear market, while above 1 indicates a bull market. aSOPR refines this by filtering out insignificant transactions within an hour, providing a more precise metric.
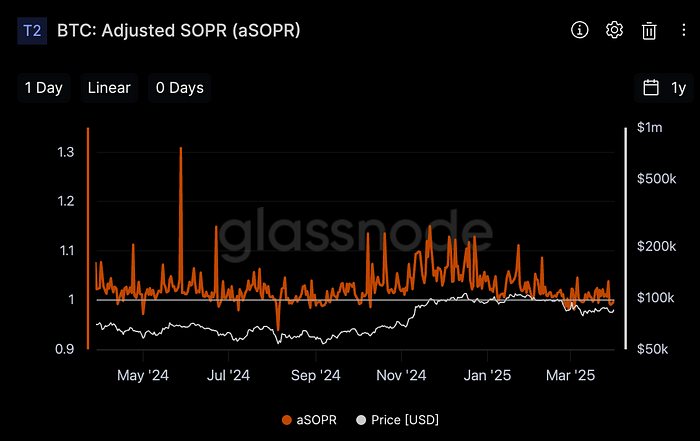 Bitcoin: aSOPR (Source: Glassnode)
- Open Interest
The open interest of Bitcoin perpetual futures saw a slight increase from $21.72B last week to $21.75B this week. On the other hand, the Estimated Leverage Ratio showed no significant change from 0.160 last week.
The absolute scale of open interest still maintains a high level, which may act as a factor that could expand market volatility. Compared to the figures before the rise in the last quarter, it is still at a high level, so caution is needed regarding market movements.
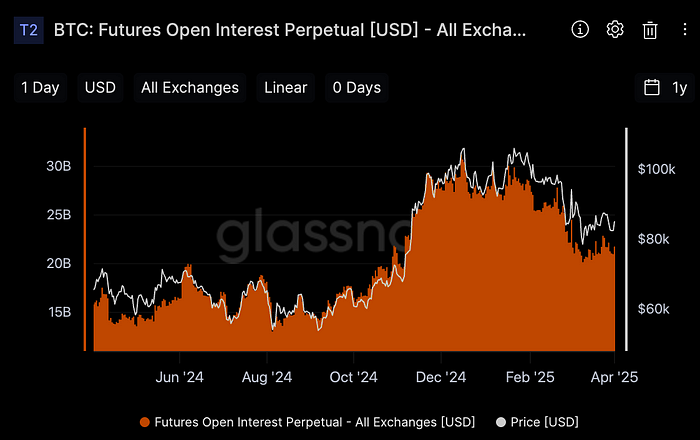 Exchange Aggregate Perpetual Futures Open Interest (Source: Glassnode)
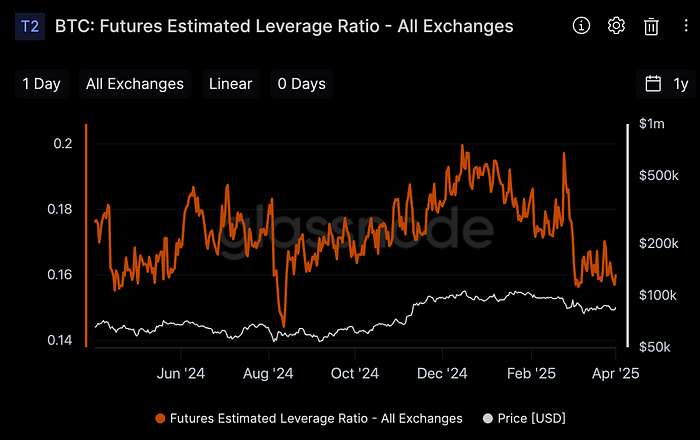 Exchange Aggregate Estimated Futures Leverage Ratio (Source: Glassnode)
4. On-chain Data
- Exchange Inflows and Outflows
The trend of net outflows of Bitcoin from exchanges continues. This means that investors are moving Bitcoin from exchanges to personal wallets, which can generally be interpreted as a positive signal that selling pressure is decreasing.
 Bitcoin: Exchange Net Inflow/Outflow Changes (Source: Glassnode)
- Whale Wallet Count
The number of whale wallets holding more than 10k Bitcoins significantly decreased last week, suggesting profit-taking during the short-term bull market. On the other hand, the number of whale wallets holding more than 1k Bitcoins increased and has been maintained until now.
These movements suggest two possibilities. First, if additional declines occur, funds may flow out from wallets holding more than 1k Bitcoins. Second, the current maintenance of the number of whale wallets holding more than 1k may act as a leading indicator driving an uptrend. To determine the future flow of the Bitcoin market, it is necessary to continuously monitor the changes in these wallets.
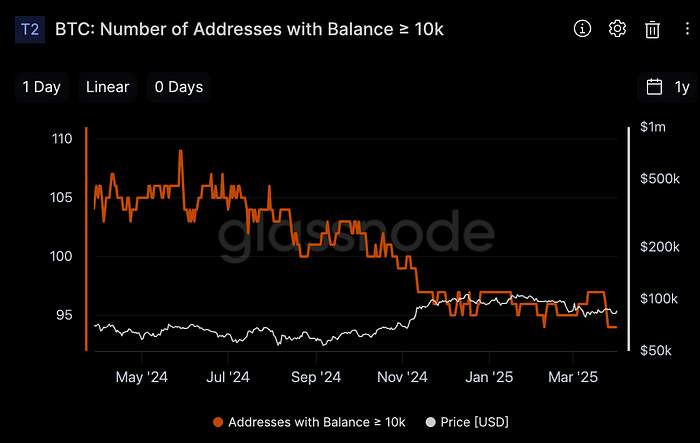 Number of Bitcoin Wallets Holding More Than 10k (Source: Glassnode)
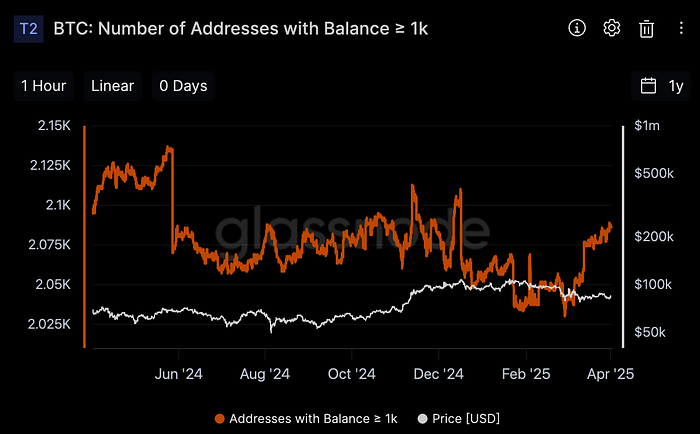 Number of Bitcoin Wallets Holding More Than 1k (Source: Glassnode)
5. Last Week’s Major News
- Sam Altman: “GPUs are melting”… OpenAI Limits ‘Ghibli Style’ Image Generation
Due to the recent trend of Studio Ghibli style in AI image generation services, OpenAI has implemented restrictions for free users citing server overload. Sam Altman (OpenAI CEO) stated on X on the 27th, “GPUs are melting” and “We will temporarily impose usage restrictions on GPT-4o image generation feature.”
After the Ghibli style AI images trended all over the internet, OpenAI implemented restrictions for its unpaid service, citing server overload. CEO Sam Altman stated on X “GPUs are meltingbut our GPUs are melting. We are going to temporarily introduce some rate limits while we work on making it more efficient. hopefully won’t be long!”.
- “Anyone who believes such rumors deserves to be poor”… CZ Dismisses Ethereum Rumors
Ethereum (ETH) plunged 13% from about $2,100 due to rumors of Binance delisting, but former Binance CEO Changpeng Zhao strongly denied this as completely false.
- Trump Tariff D-1… Wall Street: “Expected Variable” Cryptocurrencies on Upward Trend
With Trump’s tariff announcement imminent, US media reported that three options are being discussed: comprehensive 20% flat-rate tariffs, country-specific customized tariffs, and low-rate tariffs limited to certain countries.
6. Major Economic Schedule
Last week, the Manufacturing PMI fell below the forecast, and new home sales also significantly underperformed expectations, causing a major shock to the US stock market. However, key economic indicators, GDP and Personal Consumption Expenditures (PCE), both exceeded forecasts, signaling a lower possibility of economic recession. These indicators represent a solid economic flow and are interpreted as having a positive impact on the overall asset market. However, it is also necessary to consider the impact of high price levels on the Fed’s interest rate policy.
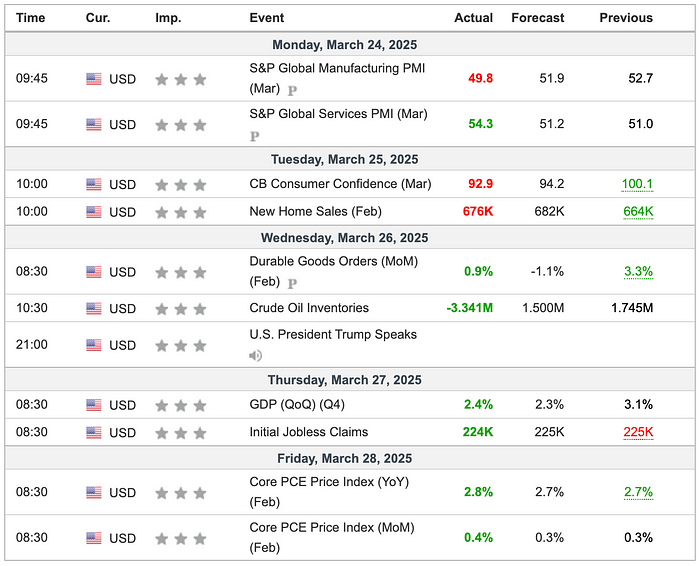 Major Economic Schedule for 4th Week of March 2025 (Source: Investing.com)
- Major Economic Schedule for This Week
This week, major US employment indicators will be announced after President Trump’s speech. Additionally, Federal Reserve Chairman Jerome Powell is scheduled to speak over the weekend, which could increase market volatility. In particular, if employment indicators come in stronger than expected, the market’s interpretation of the Fed’s interest rate policy could change, so caution is needed regarding expanded volatility during the weekend.
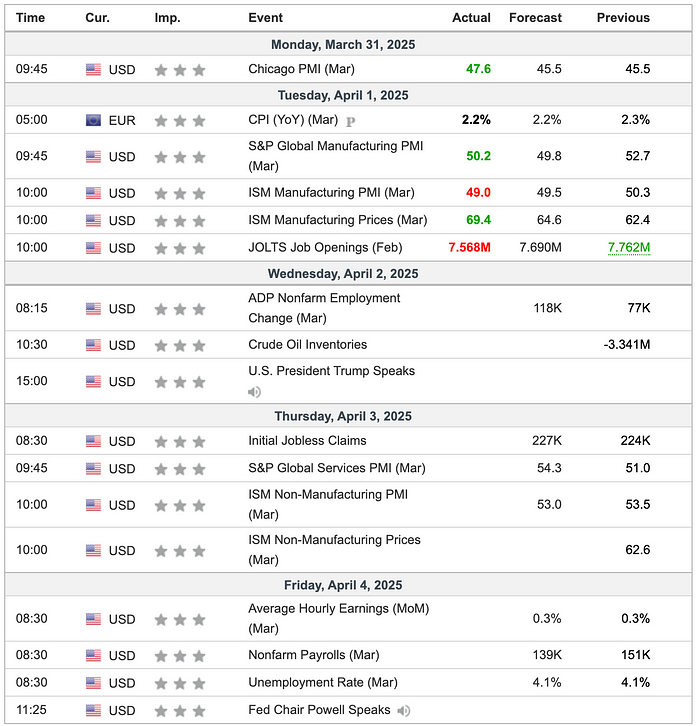 Major Economic Schedule for 1st Week of April 2025 (Source: Investing.com)
Summary
Positive indicators: Gold price, Exchange outflows, Number of whale wallets holding more than 1k
Negative indicators: Bitcoin spot ETF capital outflows, aSOPR, Open interest
Overall assessment: Market uncertainty has peaked as the announcement of US tariff policy is imminent. On a positive note, the resolution of uncertainty could lead to a rebound in the asset market, but risk indicators such as open interest are still at high levels, requiring a cautious approach. It seems that a safer strategy would be to check the market’s reaction after President Trump’s tariff policy announcement on April 2 and then enter new positions.