공지사항
주간 리포트
Downtrend in crypto persists amid tariff war, with short term trading strategies and staggered buying at lows remaining effective — 2nd week of April 2025
League of Traders EN
|
2025.04.08 06:07 (UTC+0)

The Weekly Report is our summary of key indicators and recent events in the crypto world that professional traders are closely monitoring. This report and other relevant information are first shared via the official League of Traders Telegram channel.
Here are our notes for the first week of April!
- Bitcoin Chart/Ethereum Chart
Bitcoin dropped again, at one point dropping to $78,000 from $85,000. The primary catalyst for this downturn was the rapid deterioration of international relations following President Trump’s tariff policy announcement, compounded by China’s subsequent reciprocal tariff measures. In the over 90 years since free trade principles became entrenched, it is rare for markets to exhibit such volatility due to tariff-related uncertainty, and expert opinions on the outlook remain divided.
Should U.S.-initiated tariffs come into effect, rising prices and inflation appear inevitable, increasing the likelihood of a consumption slowdown and potential economic recession. Consequently, markets are witnessing a pronounced shift of capital toward safe-haven assets such as Treasuries and gold. However, Bitcoin continues to struggle to gain recognition as a safe-haven asset.
Nevertheless, given Bitcoin’s unique characteristics and potential for restored confidence, it could exhibit a faster recovery compared to other assets during a rebound. Notably, the recent modest shift of Bitcoin Spot ETF flows into net inflows offers a positive signal.
Ultimately, the trajectory of Bitcoin and the broader cryptocurrency market will likely depend heavily on the unfolding of Trump’s tariff war. As this issue appears unlikely to resolve in the short term, the current bearish trend may persist, and even temporary rebounds are expected to lack the strength for a definitive trend reversal.
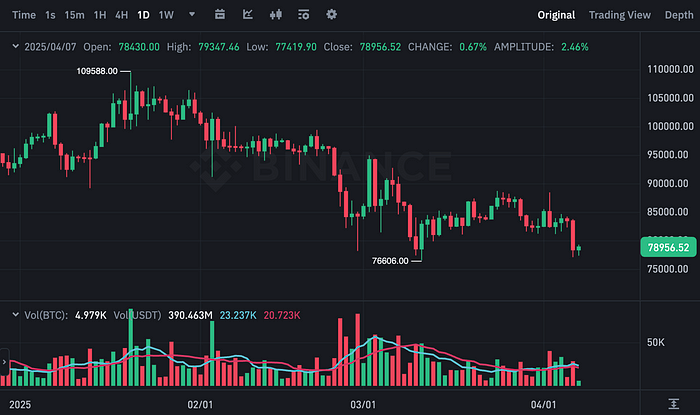 BTCUSDT Chart (Binance)
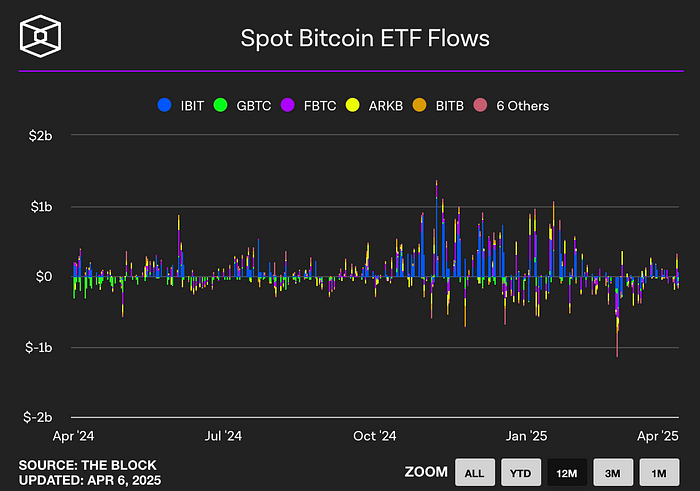 Spot Bitcoin ETF flows (The block)
Ethereum, which held steady at around $1,890 last week, has seen a significant decline this week, dipping into the $1,500s. While rumors of a Binance delisting were dispelled by CEO Changpeng Zhao, market sentiment continues to view Ethereum as a less stable asset compared to Bitcoin. This perception has driven sustained capital outflows, with Ethereum Spot ETF flows also reflecting a clear trend of net outflows, necessitating caution for further downside risks.
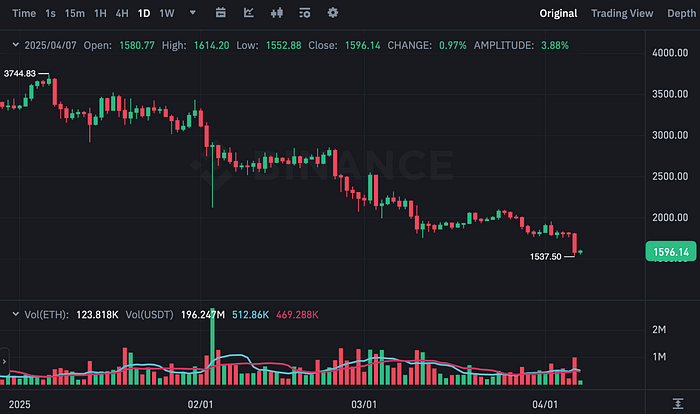 ETHUSDT Chart (Binance)
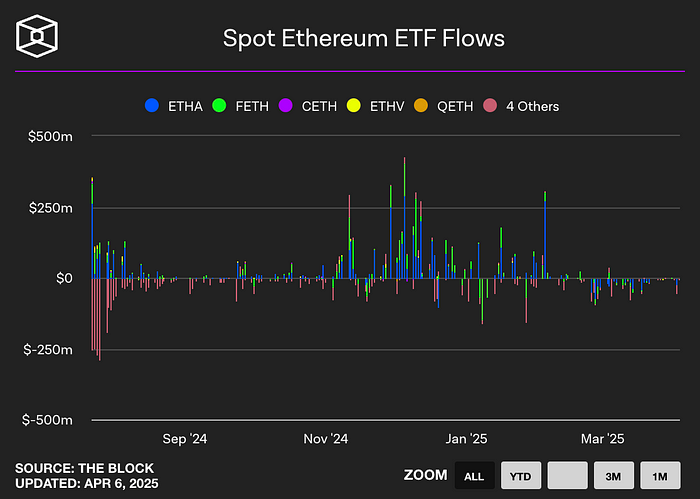 Spot Ethereum ETF flows (The block)
Bitcoin dominance has continued to climb, rising from 62.69% last week to 63.32% this week, underscoring Bitcoin’s relative resilience. While the cryptocurrency market as a whole is not currently regarded as a safe-haven asset and remains in a downtrend, Bitcoin is demonstrating greater stability compared to altcoins. Capital inflows into risk assets, including altcoins, are unlikely until market uncertainty dissipates, and with no clear positive catalysts in sight, the current subdued trend is expected to persist. That said, in a potential rebound scenario, altcoins may exhibit stronger upside momentum, warranting careful monitoring.
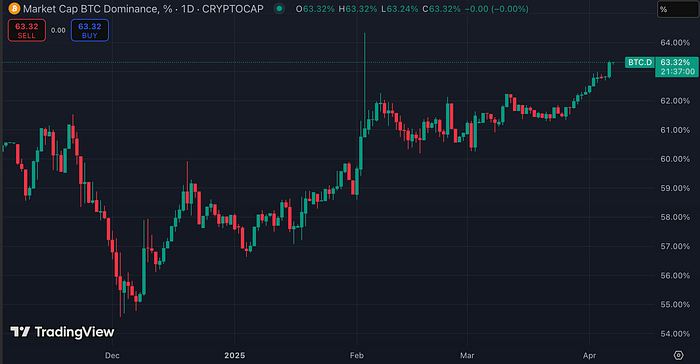 Bitcoin dominance chart (CoinMarketCap)
2. Major Economic Indicators
- US Bond Yields
The U.S. 10-year Treasury yield dropped sharply from 4.192% last week to 3.938% this week. This decline reflects investors flocking to the safety of Treasuries amid escalating uncertainty surrounding tariff policies. Significant volatility is anticipated moving forward, and this could influence potential shifts in the Federal Reserve’s interest rate strategy, requiring close attention.
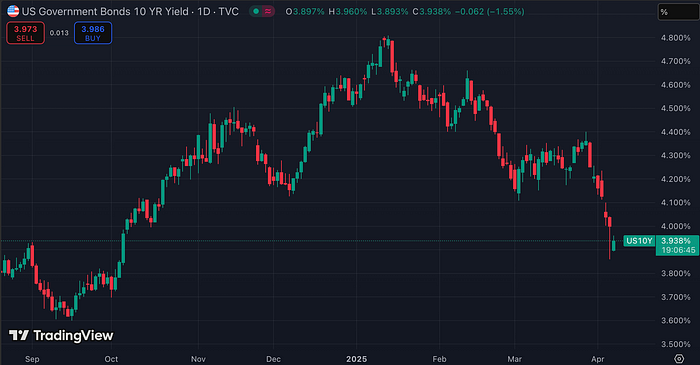 US10YPrice Government Bond Rate (TradingView)
- US Dollar Index
The U.S. Dollar Index (DXY) fell from 104.205 last week to 102.999 this week, with intraday dips below 102 amplifying volatility. This weakening is attributed to the formalization of U.S. tariff policies, raising the prospect of retaliatory tariffs from other nations. Should such measures materialize, countries may move to defend their currencies, potentially pressuring the U.S. dollar further into relative weakness.
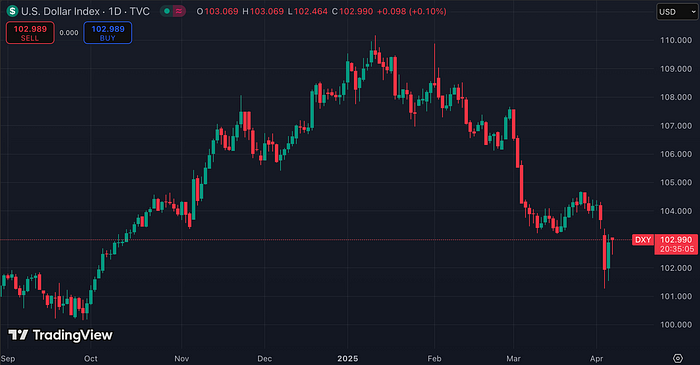 US Dollar Index (TradingView)
- US100 (Nasdaq 100)
The US100 index plummeted from the 19,000s last week to 16,786 this week, recording a drop that ranks among the top five single-day declines in its history. This sharp fall was triggered by market shock following the U.S. tariff policy announcement, compounded by concerns that reciprocal tariffs from key nations like China could negatively impact U.S. corporate earnings. The combination of tariff-induced price increases and weakening consumer sentiment has heightened fears of a broader economic downturn.
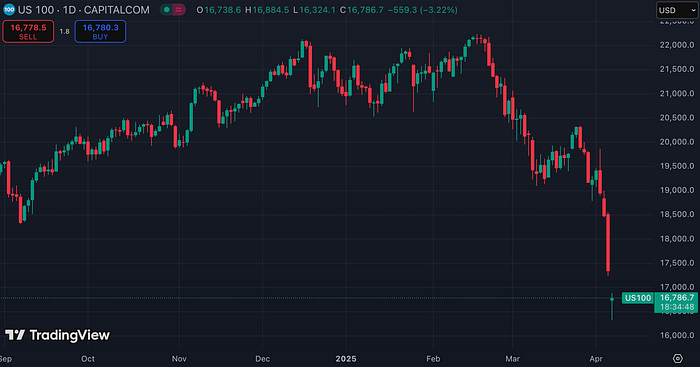 US100 (TradingView)
- Gold Futures
Gold futures surged to an all-time high of $3,150 per ounce last week but have since corrected to approximately $3,045. The inability to sustain this upward trajectory may be linked to rumors that Germany’s incoming government plans to physically withdraw gold stored in the U.S. Should such actions undermine confidence in U.S. gold reserves, it could broadly erode trust in gold exchanges.
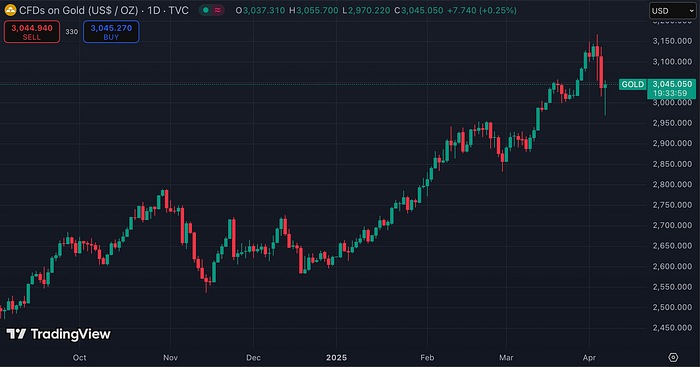 Gold Futures (TradingView)
3. Bitcoin Market Data
- MVRV Z-score
The MVRV Z-Score declined significantly from last week’s 1.90 to 1.56 this week, indicating a cooling of market exuberance. In severely contracted markets historically, this metric has dropped below 0, often coinciding with cycle bottoms. The current 1.56 level sits in neutral territory, suggesting an environment unconducive to speculative overbought conditions.
Indicator Explanation: The MVRV Z-Score measures the difference between Bitcoin’s market cap and realized cap, divided by standard deviation, offering insight into whether Bitcoin is over- or undervalued. A score below 0 indicates significant undervaluation, while the overheated zone during the 2021 all-time high exceeded 6.
 Bitcoin: MVRV Z Score(Glassnode)
- aSOPR
The aSOPR indicator edged up from 0.997 last week to 0.999 this week but remains below 1, signaling a persistent bearish trend. This reflects a market shift toward loss-taking rather than profit realization, a hallmark of a typical downtrend.
Indicator Explanation: SOPR (Spent Output Profit Ratio) divides the price of Bitcoin at the time of spending by its price when received. A value below 1 suggests a bear market, while above 1 indicates a bull market. aSOPR refines this by filtering out insignificant transactions within an hour, providing a more precise metric.
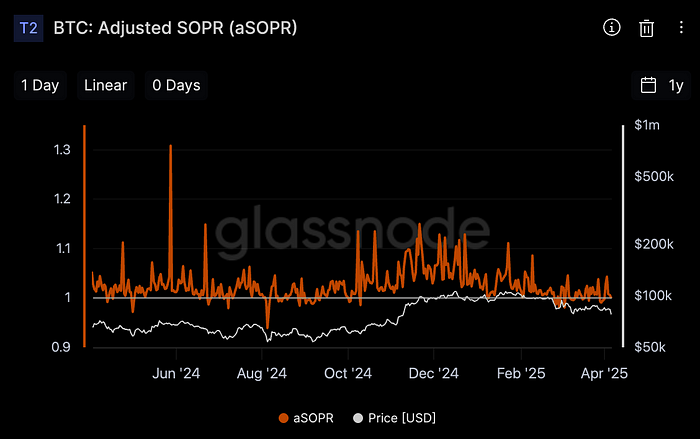 Adjusted SOPR (Glassnode)
- Open Interest
Open interest in Bitcoin perpetual futures decreased slightly from $21.75 billion last week to $20.80 billion this week. However, it remains elevated compared to last year, and a drop to at least $18 billion would be needed to confirm the unwinding of overheated positions. Meanwhile, the estimated leverage ratio rose from 0.160 to 0.167, suggesting some capital has exited the perpetual futures market. This increase in leverage amid reduced overall funds highlights the need for caution.
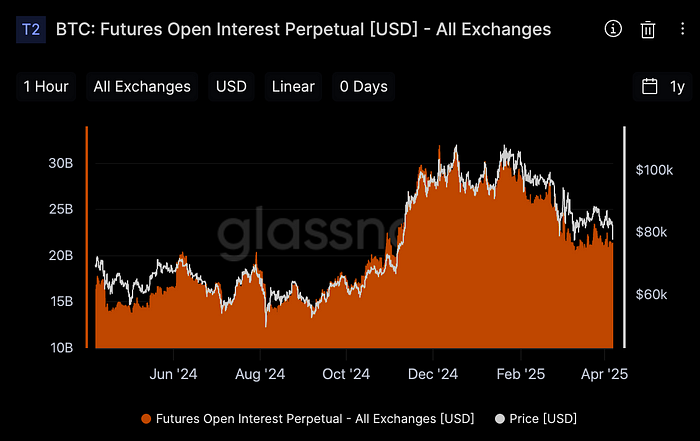 Outstanding Open Interests by Exchanges (Glassnode)
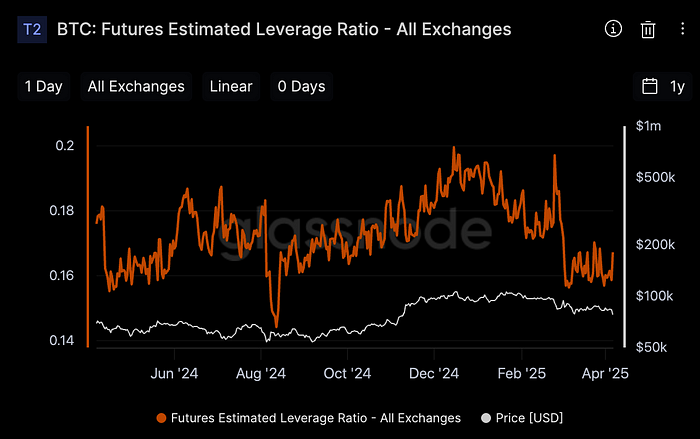 Exchanges’ combined estimated leverage ratio (Glassnode)
4. On-chain data
- Exchange inflows and outflows
Bitcoin’s net outflow trend from exchanges persists, indicating that investors are moving assets to personal wallets. This typically signals reduced selling pressure and is viewed as a positive development. If sustained, this could bolster Bitcoin’s price over the medium to long term.
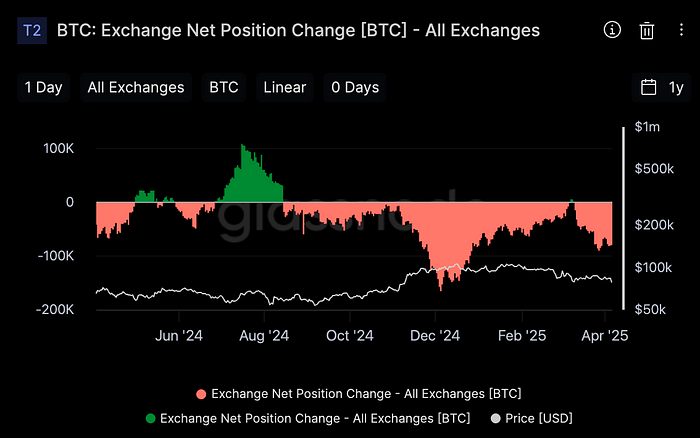 Bitcoin: Exchange Net Position Change (Glassnode)
- Number of Whale Wallets
The number of wallets holding 10,000+ BTC has continued to decline following last week’s sharp drop, suggesting that major investors view current market conditions unfavorably. In contrast, wallets holding 1,000+ BTC have remained relatively stable since their prior increase. Further price declines could drive additional reductions in whale holdings, potentially manifesting as off-exchange (OTC) transactions. The trajectory of 1,000+ BTC wallets may serve as a key indicator of near-term market recovery potential; a decline here could hinder short-term rebound prospects.
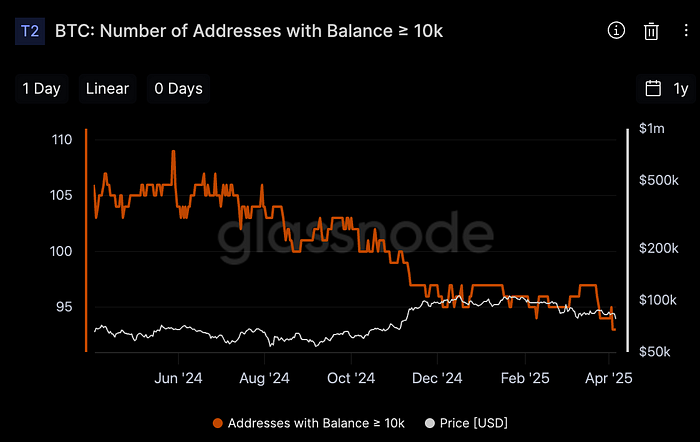 Number of Bitcoin wallets holding 10K or more (Glassnode)
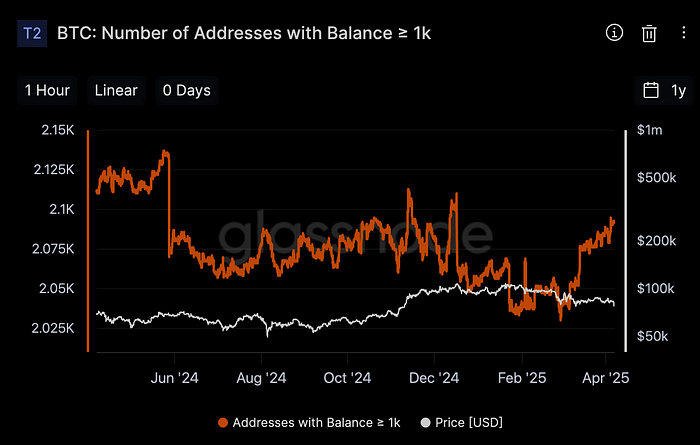 Number of Bitcoin wallets holding 1K or more (Glassnode)
5. Last Week’s Major News
Trump Signals No Retreat on Tariff Policy Toward China
Speaking to reporters aboard Air Force One en route to the White House from Florida, Trump emphasized that he would not negotiate unless the trade deficit with China was resolved, adding “I don’t want anything to go down, but sometimes you have to take medicine to fix something.” Despite stock market turmoil, this reaffirms his commitment to addressing structural trade imbalances through sustained tariff policies.
Bitcoin Posts Worst Q1 in a Decade, Reigniting ‘Cycle End’ Debate
CoinDesk reported that Bitcoin suffered an 11.7% decline in Q1, marking its weakest first-quarter performance in ten years. According to research from New York Digital Investment Group (NYDIG), this ranks as the 12th-worst quarter out of the past 15, the lowest since 2015.
Arthur Hayes: “The Era of U.S. Treasury Bonds is Over… The Era of Gold and Bitcoin is Coming”
BitMEX co-founder Arthur Hayes asserted that the global monetary order dominated by U.S. assets is nearing its end. He predicted that gold and Bitcoin will emerge as the new global stores of value.
6. Major economic events
Last week’s major economic events last week
Last week’s U.S. initial jobless claims fell below expectations, signaling ongoing labor market resilience. Non-farm payrolls also exceeded the forecast of 137,000, reaching 228,000, though a slight uptick in the unemployment rate introduced a mixed outlook. Federal Reserve Chair Jerome Powell’s mention of potential temporary price pressures and inflation tied to tariffs has added to market concerns, posing an additional burden amid upcoming economic data releases.
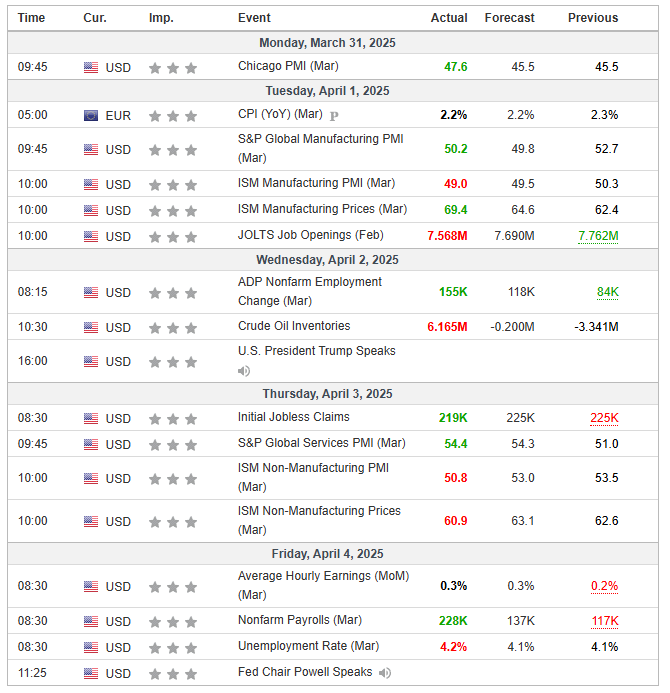 Major Economic Events for the 1st week of March 2025 (Investing.com)
This week’s major economic events
The release of the Federal Open Market Committee meeting minutes is scheduled this week, drawing significant attention as it may reveal the economic and monetary policy stances of President Trump and Fed officials. Additionally, key employment indicators, including initial jobless claims, are due for release. The labor market’s trajectory could shape the short-term direction of asset markets, making this a pivotal week.
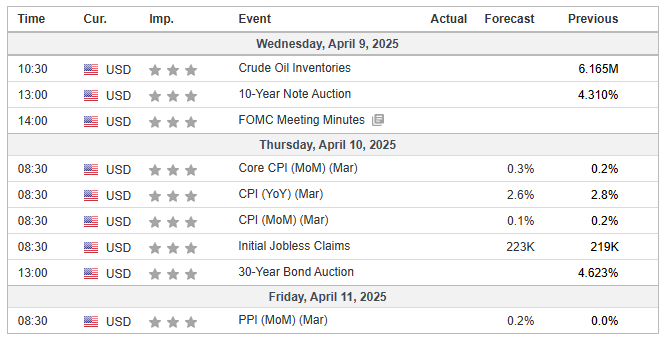 Major Economic Events for the 2nd week of April 2025 (Investing.com)
Summary
Positive Indicators: Bitcoin Spot ETF flows, Exchange net flows, Wallets holding 1,000+ BTC
Negative Indicators: Bitcoin dominance, US100, MVRV Z-Score, aSOPR, Open interest, Estimated leverage ratio, Wallets holding 10,000+ BTC
Overall Assessment:
Heightened geopolitical tensions stemming from Trump’s tariff policies and China’s retaliatory measures have cast a shadow over the cryptocurrency market, driving a broad downtrend. Most indicators, including those tied to Bitcoin, signal a prevailing decline, with capital increasingly shifting toward safe-haven assets such as gold and Treasuries. While Bitcoin could see inflows if it regains trust, a sustained upward trend appears unlikely in the near term. Short-term rebounds remain plausible, and altcoins at recent lows may offer room for technical recoveries. Strategies focused on short-term trading and staggered buying at support levels are currently viable.