공지사항
이벤트
Sustained On-Chain Bullish Momentum; Flexible Response with Staggered Buying Required — 3rd Week of May 2025
League of Traders EN
|
2025.05.14 05:40 (UTC+0)

The Weekly Report is our summary of key indicators and recent events in the crypto world that professional traders are closely monitoring. This report and other relevant information are first shared via the official League of Traders Telegram channel.
Here are our notes for the third week of May!
- Bitcoin Chart/Ethereum Chart
This week, Bitcoin breached $100,000 but encountered strong resistance near $105,000, entering a short-term consolidation phase. The current price range is interpreted as a breather following a robust rally, with the upward trendline remaining intact. While trading volume has gradually declined, it suggests sustained buying interest rather than a reversal. A breakout above $105,000 could pave the way for a move to $110,000, but a breach below the $103,000 support level may signal a short-term correction.
The Bitcoin Spot ETF market, led by products like IBIT and FBTC, has seen renewed net inflows, aligning with Bitcoin’s recent breakthrough above $100,000 and reflecting restored institutional confidence. However, last week’s inflow volumes were modest, and a shift to outflows could exert downward pressure on Bitcoin’s price.
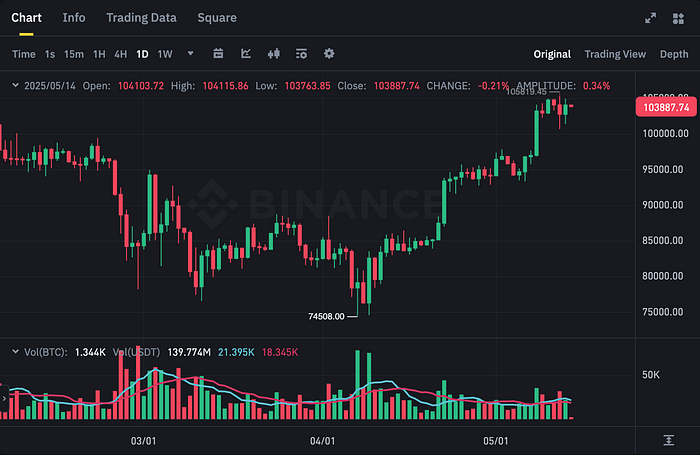 BTCUSDT Chart (Binance)
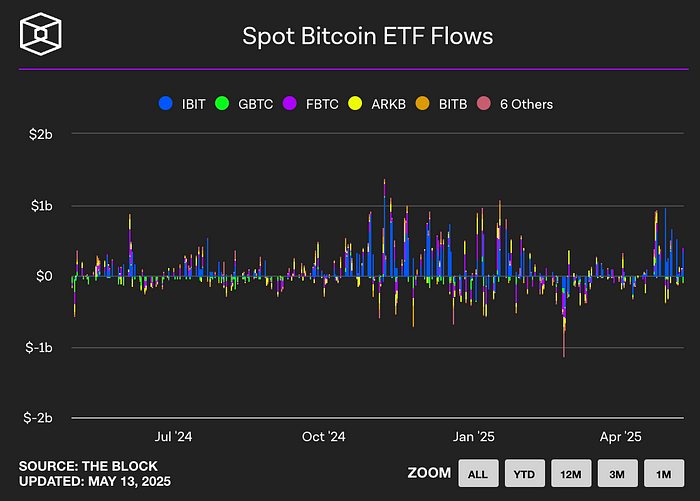 Spot Bitcoin ETF flows (The Block)
Ethereum surged from the $1,800s last week to reclaim $2,700, marking a technical breakout from its prior consolidation zone and a supply-driven rally. Accompanying trading volume underscores the strength of this buying pressure. However, profit-taking may emerge post-rally, making a strategy of buying on pullbacks to the $2,700 support level effective. A drop below $2,500 could indicate a shift to a short-term correction phase. Ethereum Spot ETF flows remain negligible, suggesting limited new institutional buying interest.
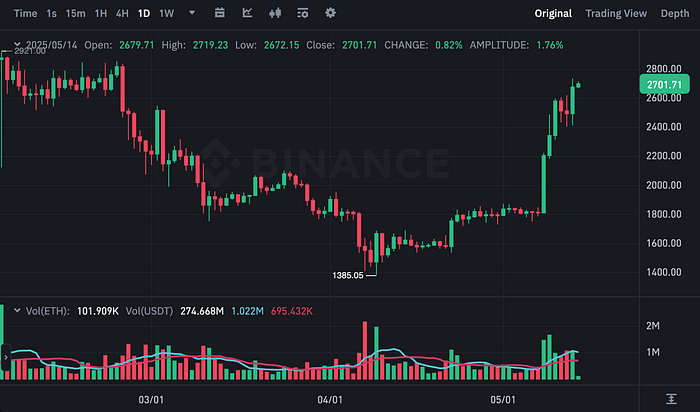 ETHUSDT Chart (Binance)
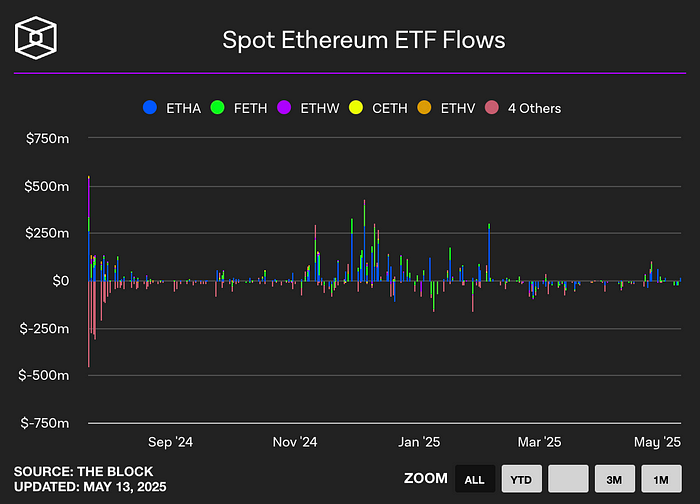 Spot Ethereum ETF flows (The block)
Bitcoin dominance dropped sharply from 65% to the 62% range this week, driven by strong rebounds in altcoins, particularly Ethereum. This decline from a short-term peak suggests capital is rotating from Bitcoin to altcoins, a key signal of a potential altcoin season. The 62–63% range will be critical for support; further declines could amplify altcoin strength.
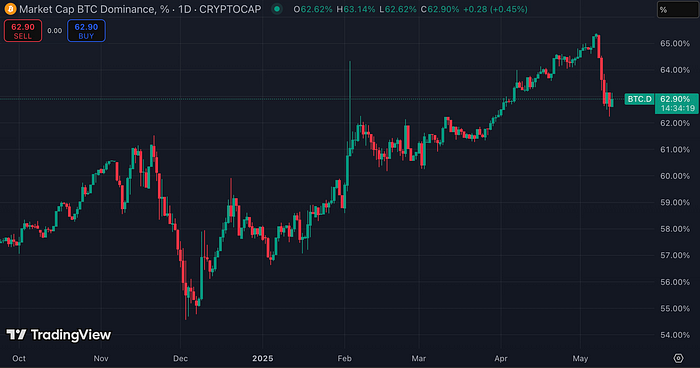 Bitcoin dominance chart (CoinMarketCap)
2. Major Economic Indicators
- US Bond Yields
The U.S. 10-year Treasury yield rose from 4.28% last week to 4.48% this week, retesting its March high. This increase reflects robust employment and inflation data, coupled with hawkish Fed rhetoric. The 4.5% level has historically been a key medium-term resistance, and its breach could significantly influence yield trends and asset markets. As higher yields may pressure risk assets, close monitoring of yield ceilings and Fed commentary is essential for strategic positioning.
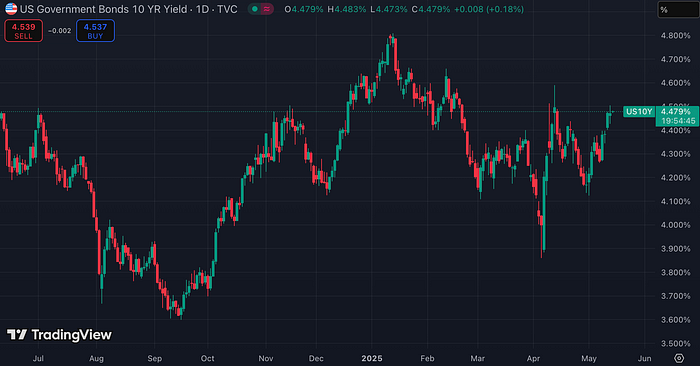 US10YPrice Government Bond Rate (TradingView)
- US Dollar Index
The U.S. Dollar Index (DXY) reclaimed the 100 level, peaking at 101 before retreating to 100.9. This technical rebound aligns with rising U.S. yields and reflects uncertainties around Fed policy and global currency dynamics. While consolidation is likely in the near term, sustained dollar strength could act as a headwind for risk assets like Bitcoin, potentially triggering short-term corrections.
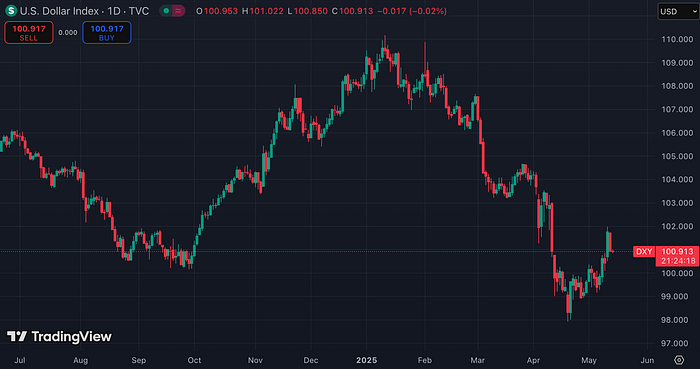 US Dollar Index (TradingView)
- US100 (Nasdaq 100)
The Nasdaq 100 index sustained its rally, recovering to 20,700 and attempting to breach 21,000. This strength is driven by inflows into tech stocks, optimism in AI and semiconductor sectors, and positive corporate earnings. The temporary resolution of U.S.-China tariff tensions, reaching prior agreement levels, has bolstered investor sentiment, stabilizing supply chains and fueling expectations of global trade recovery. Technically, the short-term uptrend remains intact, but new catalysts are needed to sustain momentum given the rapid recovery.
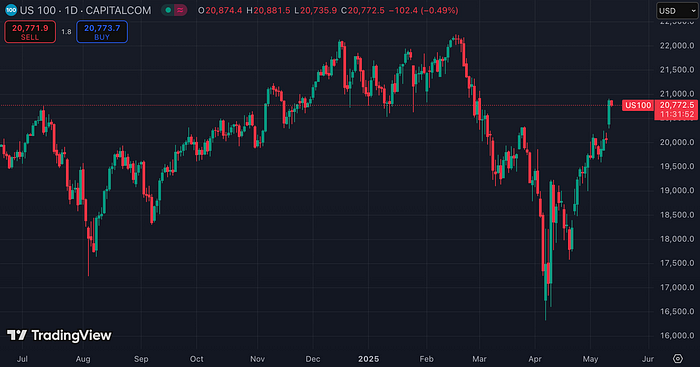 US100 (TradingView)
- Gold Futures
Gold futures, after peaking near $3,450 in late April, entered a correction phase, testing support in the low-to-mid $3,200 range. This pullback reflects rising U.S. yields, a rebounding dollar, and easing U.S.-China tariff tensions reducing risk-off sentiment. However, gold’s long-term uptrend remains intact, supported by geopolitical uncertainty and safe-haven demand. A retest of higher levels is likely if $3,200 holds as support.
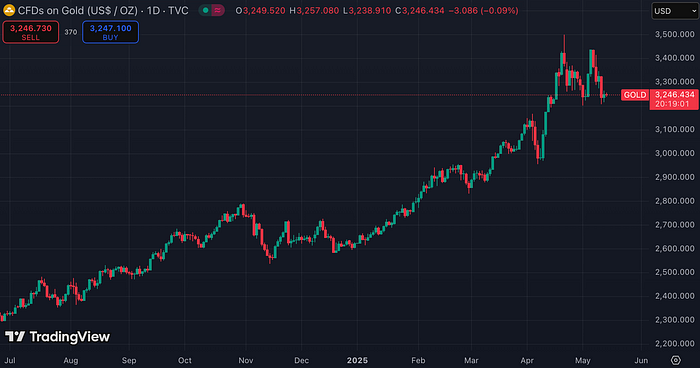 Gold Futures (TradingView)
3. Bitcoin Market Data
- MVRV Z-score
As of May 2025, Bitcoin’s MVRV Z-Score stands at approximately 2.6, transitioning from neutral to a moderately overvalued range. This reflects increasing profit-taking incentives as Bitcoin surpasses $100,000. Historically, a Z-Score above 3 has signaled short-term overheating, often preceding corrections. Should the Z-Score approach or exceed 3, strategies such as partial profit-taking or defensive positioning may be prudent.
Indicator Explanation: The MVRV Z-Score measures the difference between Bitcoin’s market cap and realized cap, divided by standard deviation, offering insight into whether Bitcoin is over- or undervalued. A score below 0 indicates significant undervaluation, while the overheated zone during the 2021 all-time high exceeded 6.
 Bitcoin: MVRV Z-Score(Glassnode)
- aSOPR
Bitcoin’s aSOPR indicator has consistently remained above 1.0, indicating that most transactions are occurring at a profit. This suggests investors view the current price trend favorably, with the rally rooted in structural recovery rather than speculative fervor, as evidenced by on-chain data.
Indicator Explanation: SOPR (Spent Output Profit Ratio) divides the price of Bitcoin at the time of spending by its price when received. A value below 1 suggests a bear market, while above 1 indicates a bull market. aSOPR refines this by filtering out insignificant transactions within an hour, providing a more precise metric.
 Adjusted SOPR (Glassnode)
- Open Interest
Bitcoin perpetual futures open interest surged to $33.4 billion, reflecting heightened market participation, while the estimated leverage ratio remains stable. This indicates the recent price rally is driven by spot or low-risk positions rather than excessive leverage, reducing the risk of sharp liquidations. However, rising leverage ratios could amplify volatility, necessitating caution.
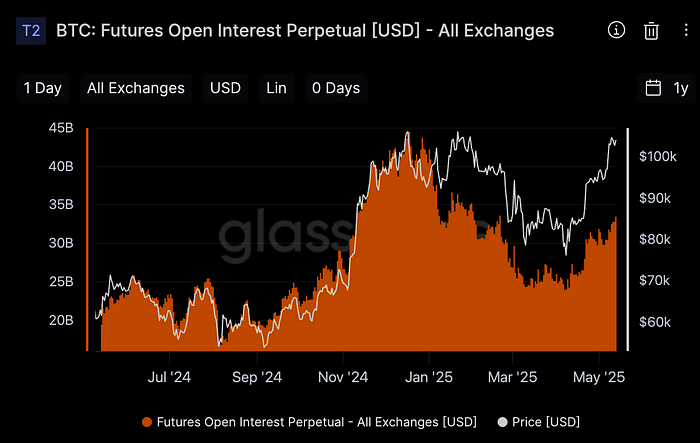 Outstanding Open Interests by Exchanges (Glassnode)
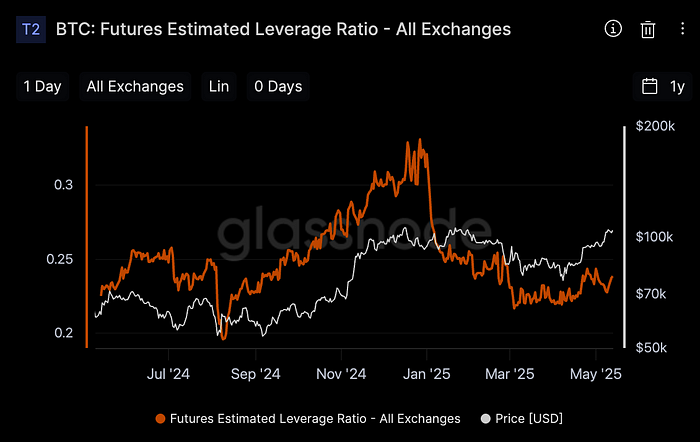 Exchanges’ combined estimated leverage ratio (Glassnode)
4. On-chain data
- Exchange inflows and outflows
Bitcoin’s net outflow trend from exchanges remains robust, signaling strengthening long-term holding sentiment. The continued movement of significant volumes to external wallets, even after Bitcoin surpassed $100,000, reflects a preference for long-term storage over short-term profit-taking, a bullish on-chain signal supporting price stability.
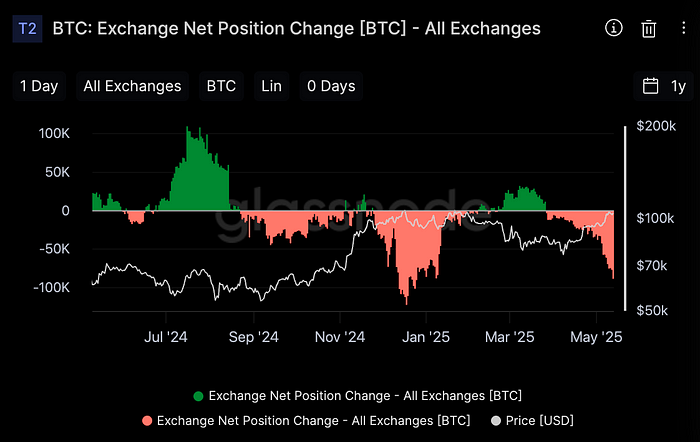 Bitcoin: Exchange Net Position Change(Glassnode)
- Number of Whale Wallets
Wallets holding 10,000+ BTC have continued a sharp decline, potentially indicating asset fragmentation or transfers to exchange custody or ETFs. Conversely, wallets holding 1,000+ BTC have steadily increased, suggesting growing accumulation by mid-tier whales. While this reflects dispersed market participation and structural shifts, the decline in ultra-large whale wallets, which often precede price movements, warrants caution for short-term downside risks.
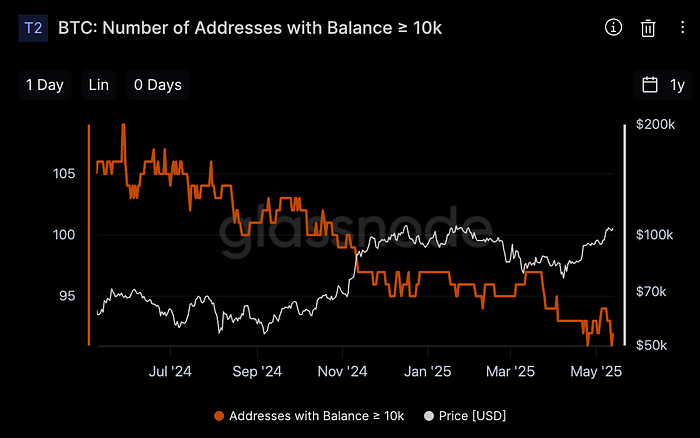 Number of Bitcoin wallets holding 10K or more (Glassnode)
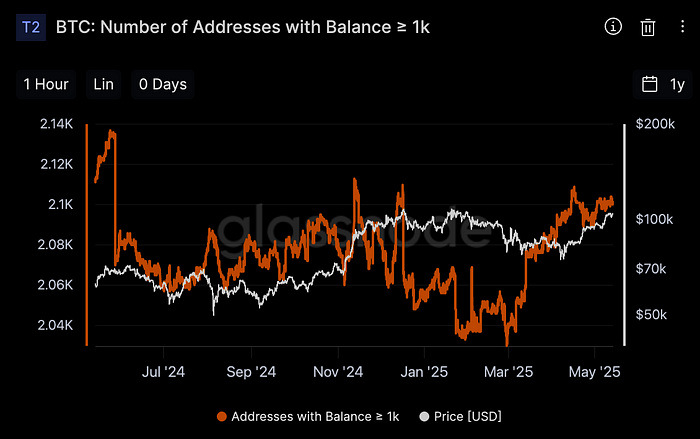 Number of Bitcoin wallets holding 1K or more (Glassnode)
5. Last Week’s Major News
New York Stock Exchange Surges, Reflecting U.S.-China Trade Optimism Major indices rallied on news of U.S.-China tariff reductions. The US100 index reclaimed 20,000 and reached 20,700, driven by a 90-day negotiation extension and tariff relief agreement.
BlackRock Buys 10,572 Bitcoins in a Week, Tripling Mining Output BlackRock’s IBIT Spot ETF acquired 10,572 Bitcoins in a single week, exceeding three times the period’s new mining output (approximately 3,150 Bitcoins). This demand, outpacing supply reduced by the halving, continues to drive Bitcoin’s price rally.
Bitcoin Dominance Falls Below 62% Bitcoin dominance dropped from a May peak of 65% to below 62%, signaling capital rotation from Bitcoin to altcoins and raising prospects for an altcoin rotation phase.
6. Major Economic Events
Major economic events last week
U.S. economic indicators showed signs of slowing in services and consumption, but non-manufacturing and employment data remained resilient, presenting mixed signals. The Federal Reserve maintained its benchmark rate at 4.50%, as expected, but reiterated a cautious stance against near-term rate cuts, potentially weighing on markets. Strong employment data may further temper rate cut expectations.
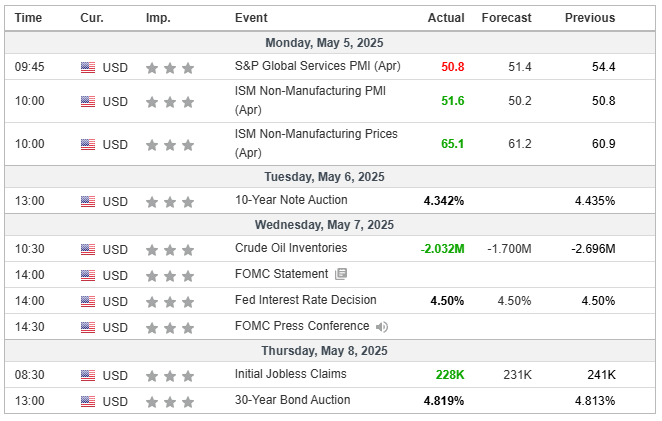 Major Economic Events for the 2nd week of May 2025 (Investing.com)
This week’s major economic events
U.S. economic indicators this week signaled easing inflationary pressures, with April’s Consumer Price Index rising below expectations, bolstering hopes for Fed rate cuts. However, core and overall retail sales weakened month-over-month, indicating potential consumption slowdowns. Amid these mixed signals, Fed Chair Jerome Powell’s upcoming speech will be critical for gauging future monetary policy direction.
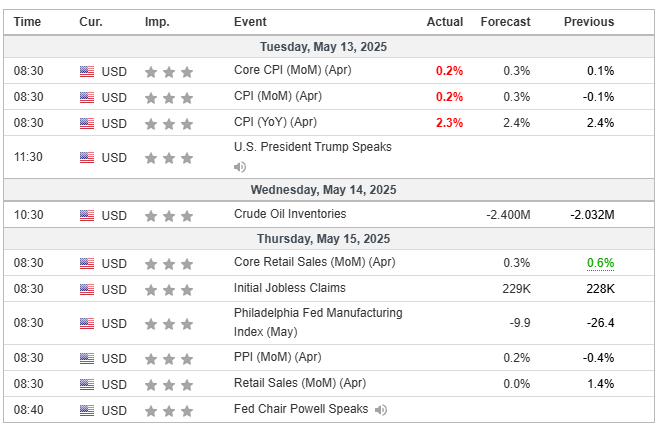 Major Economic Events for the 3rd week of May 2025 (Investing.com)
Summary
Positive Indicators: Bitcoin Spot ETF inflows, Bitcoin dominance, MVRV Z-Score, aSOPR, Estimated Leverage Ratio (ELR), Exchange net flows, Wallets holding 1,000+ BTC
Negative Indicators: Wallets holding 10,000+ BTC, U.S. 10-year Treasury yield, U.S. Dollar Index, Gold futures prices, Open interest levels
Overall assessment: This week, robust on-chain metrics and ETF inflows reinforced Bitcoin’s bullish momentum. However, rising yields, a strengthening dollar, and declining ultra-large whale wallets present potential headwinds, keeping short-term correction risks alive. Cryptocurrency investors are advised to capitalize on the uptrend but prioritize staggered buying during pullbacks over aggressive momentum chasing to navigate potential volatility.